Fig. 3.
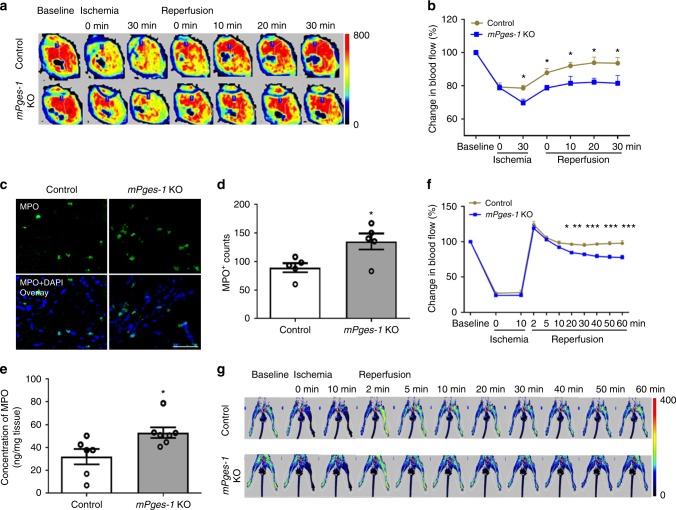
Essential role of mPGES-1 in preserving microcirculation during I/R. Cardiac microvascular perfusion (percentage change relative to baseline) was recorded at indicated time points before and after release of coronary ligation in mPges-1 WT and KO mice, as detailed in the Methods. Representative perfusion images at each time point were shown (a). Relative change in blood flow was analyzed (b). Immunofluorescent staining of myeloperoxidase (MPO, in green) was carried out on the heart sections, and representative photos were shown (c). MPO-positive cells (d) and tissue levels of MPO (e) in the ischemic area were quantified. Distal microvascular perfusion was also measured during hindlimb I/R. Microvascular flow relative to baseline was recorded at indicated time points before and after release of the artery ligation (f), with representative perfusion images at each time point shown (g). At the baseline before ischemia, no difference in cardiac perfusion (514 ± 13 vs 526 ± 18 PU, n = 17, 14, unpaired Student’s t test) or in hindlimb perfusion (86 ± 6 vs 90 ± 4 PU, n = 5, unpaired Student’s t test) was observed between control and mPges-1 KO. Two-way ANOVA with Bonferroni’s test (b, n = 12, 11; f, n = 5). Unpaired Student’s t test (d, n = 5; e, n = 6, 7). Scale bar is 50 μm. Error bar indicates SEM

