Fig. 2.
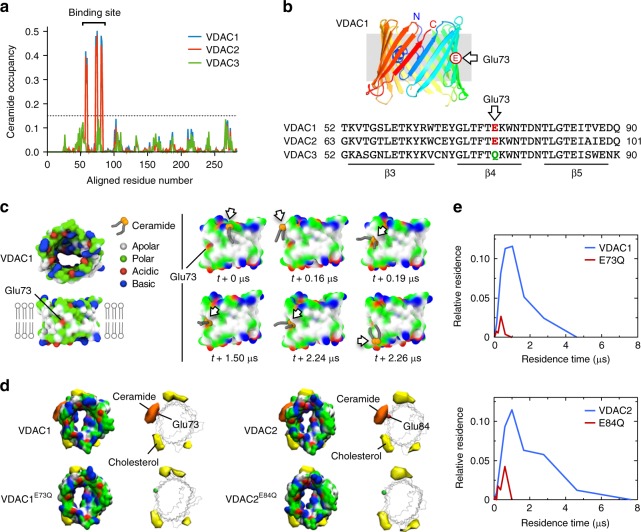
MD simulations uncover a putative ceramide-binding site on VDAC1 and -2. a Ceramide head group contact occupancy of mouse VDAC1, VDAC2, and VDAC3 in an OMM model containing 5 mol% ceramide, with 1.0 corresponding to a ceramide contact during the entire simulation time. A threshold of 15% occupancy, based on the occupancies of non-binding site residues, is indicated by a dotted blue line. VDAC1 and VDAC2 have a clear ceramide-binding site, comprising residues 58–62, 71–75, and 81–85; this site is lacking in VDAC3. b Sequence alignment revealing the position of a bilayer-facing Glu residue in VDAC1 (E73) and VDAC2 (E84), which is replaced by Gln in VDAC3 (Q73). c Stills from an MD simulation, showing the approach and binding of a ceramide molecule to VDAC1 in close proximity of the bilayer-facing Glu residue in its deprotonated state. Protein surface colors mark polar (green), apolar (white), cationic (blue), or anionic (red) residues. d Space-filling and wireframe models of VDAC1, VDAC1E73Q, VDAC2, and VDAC2E84Q with deprotonated E73/E84. Indicated are the volumes for which there is ceramide occupancy greater than 10% (orange) or cholesterol occupancy greater than 20% (yellow). e Distribution of the durations of ceramide contacts with VDAC1, VDAC1E73Q, VDAC2, and VDAC2E84Q at the preferred binding site as in d. The y-axis indicates the fraction of the total system time spent in binding events of the duration indicated by x. Summing all points’ y-values yields the fraction of total simulation time when ceramide was bound

