Fig. 3.
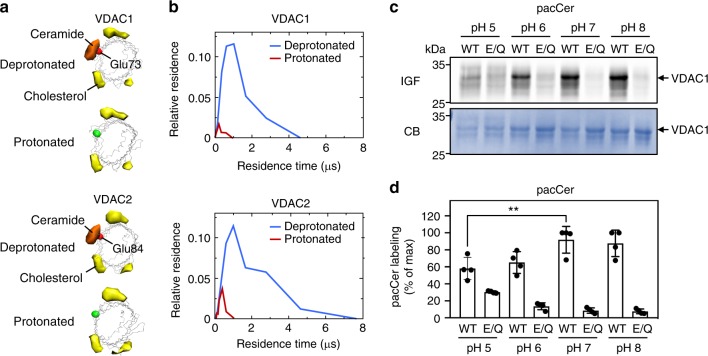
Ceramide binding by VDACs relies on the protonation state of the bilayer-facing Glu. a Space-filling and wireframe models of VDAC1 and VDAC2 simulated with the bilayer-facing Glu residue in a protonated or deprotonated state. Indicated are the volumes for which there is ceramide occupancy greater than 10% (orange) or cholesterol occupancy greater than 20% (yellow). b Distribution of the durations of ceramide contacts with VDAC1 and VDAC2 at the preferred binding site as in a. The y-axis indicates the fraction of the total system time spent in binding events of the duration indicated by x. Summing all points’ y-values yields the fraction of total simulation time when ceramide was bound. c Human VDAC1 and VDAC1E73Q were produced in E. coli, purified, reconstituted in liposomes, and then photolabeled at the indicated pH with pacCer added from an ethanolic stock. Samples were click-reacted with AF647-N3, subjected to SDS-PAGE, and analyzed by IGF and CB staining. d Quantitative analysis of relative pacCer photolabeling efficiencies of reconstituted VDAC1 treated as in c. Data are means ± s.d.; n = 4; **p < 0.01 by two-tailed paired t-test. Source data

