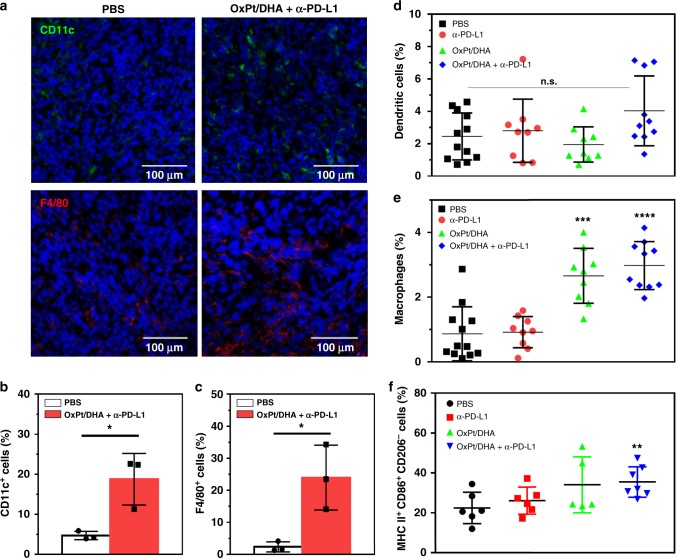
Fig. 7.
Tumour infiltration of innate immune cells. a Immunofluorescence analysis showing the infiltration of dendritic cells and macrophages 2 days after treatment. b, c The densities of CD11c+ (b) and F4/80+ (c) cells in the whole tumours 2 days after treatment, from the confocal images of immunofluorescence staining (n = 3). d, e The percentages of dendritic cells (d), total macrophages (e) and M1 macrophages (f) by flow cytometry of cell-surface staining 12 days after the first treatment. Data are each pooled from three independent experiments for (d) and (e). Data were obtained without repetition for (f). *p < 0.05, **p < 0.01, ***p < 0.001, ****p < 0.0001 by Student’s two-tailed t test

