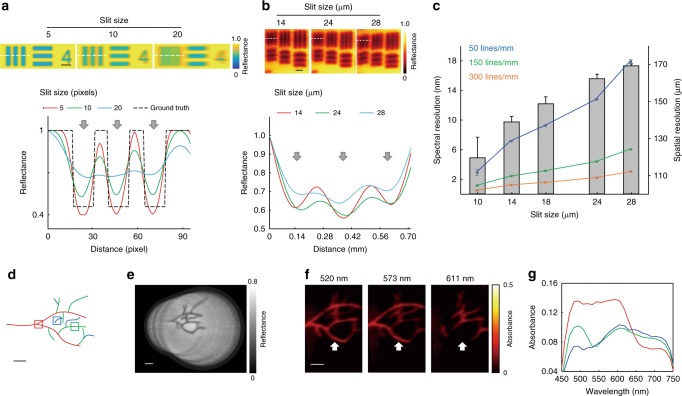
Fig. 4.
Characterisation of spatiospectral resolution of HySE. Spatiospectral resolution and signal intensity can be optimised by adjusting the spectrograph slit size, which enables hyperspectral imaging (HSI) during freehand motion. a Maximum intensity projection of simulated spectral images of a USAF 1951 test target at three different slit sizes (5, 10 and 20 pixels). Grey arrows indicate the three vertical lines across which the intensity profile (white dashed line) is quantified in the graph. The three chart elements are clearly resolved for slit sizes of 5 or 10 but at a slit size of 20 pixels, contrast is lost. b Experimentally measured images of a USAF 1951 test target at three different slit sizes (14, 24 and 28 μm). As in simulation, the three chart elements lose contrast as the slit size increases. Images show a representative slice of the hypercube at 518 nm. c The graph shows the trade-off between spatial resolution (bar graph; right axis) and spectral resolution (line graph; left axis) at the same exposure time for different slit sizes. Images acquired using external illumination. Error bars represent standard deviation in bars and lines. d A vascular tree phantom was created using three colours to demonstrate freehand HSI (see also Supplementary Movie 2). The internal illumination method was used during freehand imaging. e During freehand imaging, wide-field registration was performed. A combination of 86 endoscopic wide-field images is shown. f Representative slice images from the reconstructed hypercube are illustrated at three wavelengths. White arrows indicate the presence and absence of red vascular structures in the different single wavelength images. Colour bar indicates absorbance. g Absorbance was quantified within the red, green and blue squares shown in d. Images acquired using internal illumination. Scale bar in simulation a = 25 pixels, scale bar in experiment b = 500 μm and scale bars in d–f = 10 mm

