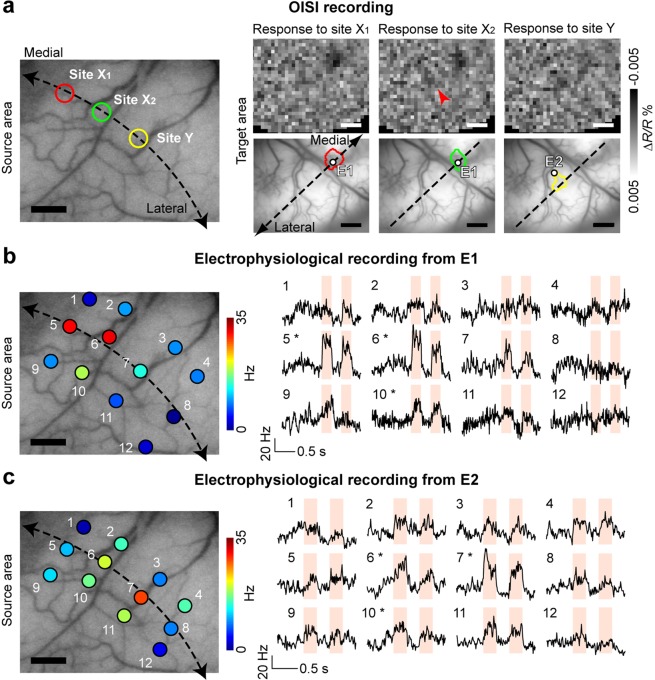
Figure 5.
Validation by scanning optogenetic stimulation sites in the source area. (a) Activation maps obtained from the preceding OISI. Left panel, sites of optogenetic stimulation (X1, X2, and Y) overlaid on the surface vessel pattern of the source area. Right panel, activation maps (top) and activation spots (bottom) elicited by stimulation of sites X1, X2, and Y. The white dots in the activation spots indicate the location of electrodes in subsequent electrophysiological recordings (E1 and E2). The activation spots elicited by stimulation of sites X1 and X2 are the reproduction of Fig. 3f,i. (b,c) Electrophysiological responses recorded from E1 (b) and E2 (c). Left panel, sites of light stimulation in the source area where color indicates mean evoked responses recorded from E1 (b) and E2 (c). Right panel, PSTHs for stimulation of sites 1–12. The shaded time periods represent periods of 2 Hz pulse optogenetic stimulation. Asterisks, significant modulation of the mean firing rate (p < 0.001, t-test) by optogenetic stimulation (shaded time periods) compared with the mean firing rate at the resting state (0.5 s period before the onset of optogenetic stimulation). Scale bars, 1 mm. Dashed lines, the V1/V2 border.

