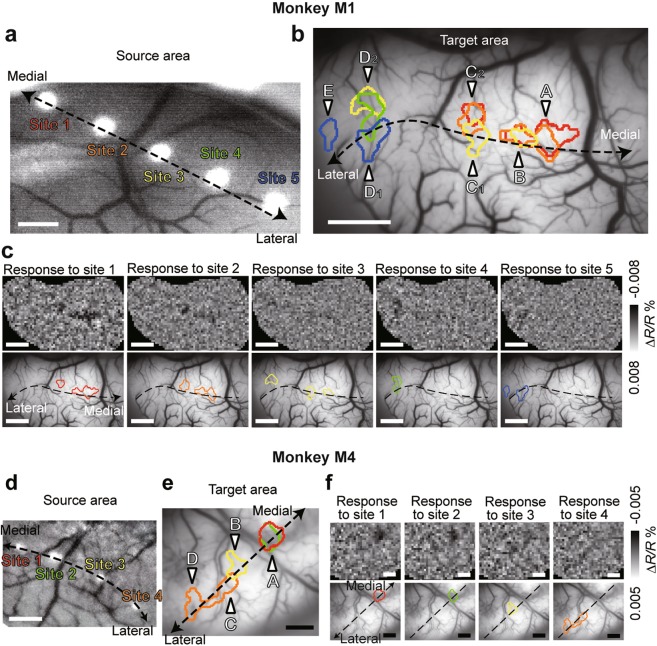
Figure 6.
Cortico-cortical projection patterns along V1/V2 borders. (a) Optogenetic stimulation sites overlaid on the surface vessel pattern of the source area. Dashed line, the V1/V2 border. (b) Activation spots evoked by the stimulation of site 1–5 are overlaid on the vessel pattern of the target area. Color of the contours corresponds to the color of stimulation sites in (a). The individual spots are identified by capital alphabets. (c) Activation patterns and spots for individual stimulation sites. These results were obtained from M1. Please note that the activation of site 5 was electrophysiologically confirmed in Fig. 4. (d–f) Cortico-cortical projection patterns obtained from a different monkey (M4). Conventions are the same as in (a–c). Scale bars in (a) and (d–f), 1 mm. Scale bars in (b) and (c), 2 mm.

