Fig. 3.
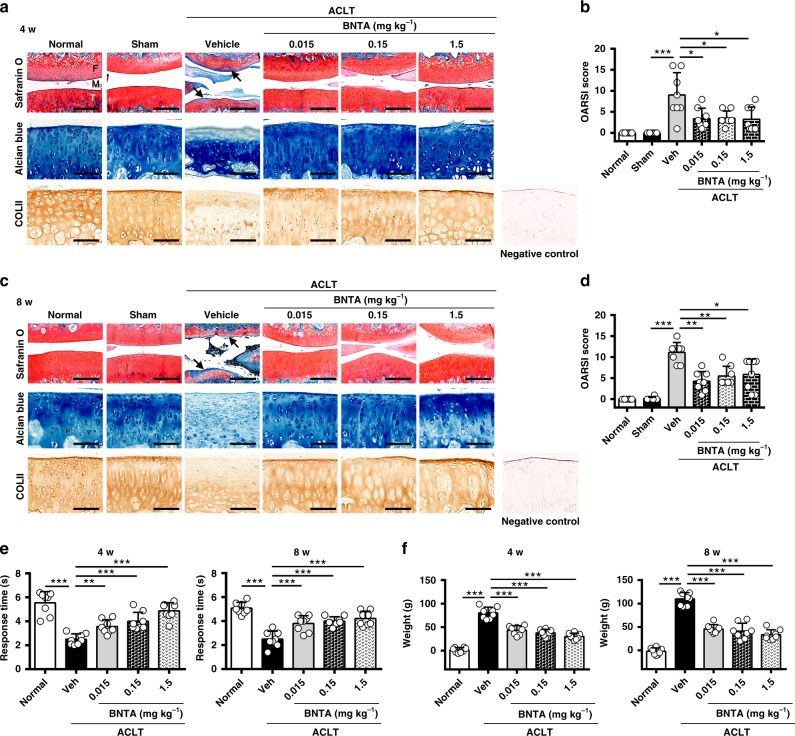
BNTA attenuated post-traumatic osteoarthritis development after intra-articular injection for 4 and 8 w. a, b Representative images of safranin O-fast green, alcian blue, immunohistochemistry staining of type II collagen (COLII), and the corresponding Osteoarthritis Research Society International (OARSI) scores from normal, sham, veh (vehicle)-treated, and BNTA-treated rats at 4 w (n = 8 for each group; nonparametric test; M, meniscus; F, femur; T, tibia; safranin O-fast green staining, scale bar, 200 μm; alcian blue and immunohistochemistry staining, scale bar, 100 μm). c, d Representative images of safranin O-fast green, alcian blue, immunohistochemistry staining of COLII, and OARSI scores in normal, sham, vehicle, and BNTA rats at 8 w (n = 8 for each group; nonparametric test; safranin O-fast green staining, scale bar, 200 μm; alcian blue and immunohistochemistry staining, scale bar, 100 μm). e Pain response times when rats were placed on the 55 °C hot plate meter at 4 w and 8 w post-surgery (n = 8 for each group, one-way ANOVA). f The difference between the weight placed on the contralateral sham (left) hindlimb and the weight placed on the anterior cruciate ligament transection (ACLT, right) one at 4 w and 8 w post-surgery (n = 8 for each group, one-way ANOVA). Each data point represents one individual rat. All data are shown as the mean ± standard deviation (s. d.). *P < 0.05, **P < 0.01, ***P < 0.001. Source data are provided as a Source Data file

