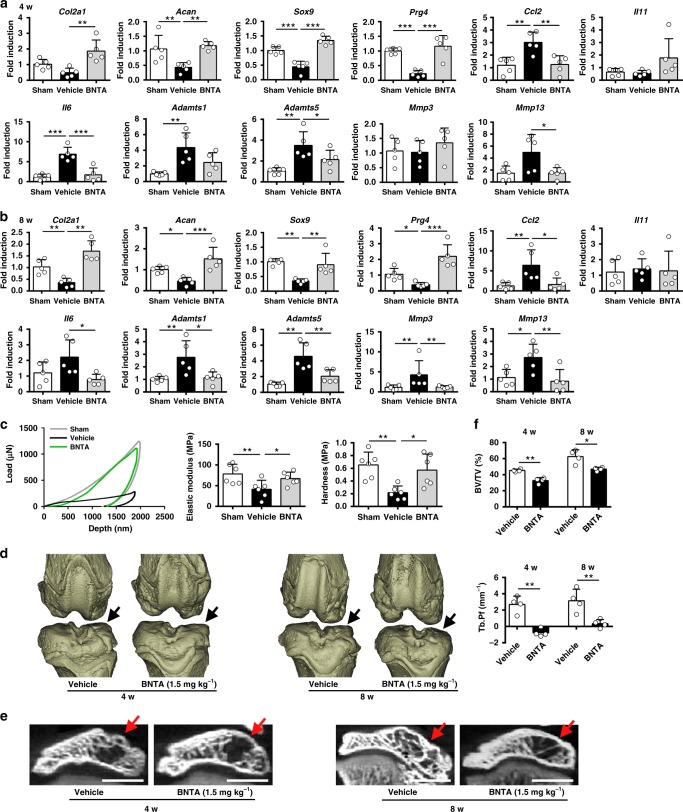
Fig. 4.
BNTA attenuated post-traumatic rat osteoarthritis development. a, b Quantification of mRNA levels for collagen type II alpha 1 chain (Col2a1), aggrecan (Acan), SRY-box 9 (Sox9), proteoglycan 4 (Prg4), C-C motif chemokine ligand 2 (Ccl2), interleukin (Il)11, Il6, ADAM metallopeptidase with thrombospondin type 1 motif (Adamts)1, Adamts5, matrix metalloproteinase (Mmp)3, and Mmp13 in articular cartilage obtained from sham, vehicle, and BNTA-treated (1.5 mg kg−1) rats at 4 w and 8 w (a, Col2a1, Acan, Sox9, Prg4, Adamts5, Ccl2, Il11, Il6, and Mmp3, one-way ANOVA; Adamts1 and Mmp13, nonparametric test; b Acan, Sox9, Prg4, Il11, and Mmp13, one-way ANOVA; Col2a1, Ccl2, Il6, Adamts1, Adamts5, and Mmp3, nonparametric test; n = 5 for each group). c Biomechanical properties of cartilage samples from sham, vehicle, and BNTA-treated (1.5 mg kg−1) rats at 4 w assessed using a nanoindentation test (n = 6 for each group; elastic modulus, one-way ANOVA; hardness, nonparametric test). d Three-dimensional models for rat knee joints in the vehicle and BNTA-treated (1.5 mg kg−1) anterior cruciate ligament transection (ACLT) rats at 4 w and 8 w. Arrows showed the medial tibial plateau. e Representative micro-CT images of subchondral bone in the medial tibial plateau of vehicle and BNTA-treated (1.5 mg kg−1) ACLT rats at 4 w and 8 w. Arrows indicated medial tibial plateau. Scale bar, 2 mm. f Quantitative micro-CT analysis of tibial subchondral bone with trabecular bone volume per total volume (BV/TV; unpaired two-tailed Student’s t-test; n = 4 for each group) and trabecular bone pattern factor (Tb. Pf; unpaired two-tailed Student’s t-test; n = 4 for each group) in the vehicle and BNTA (1.5 mg kg−1) groups at 4 w and 8 w. Each data point represents one individual rat. All data are shown as the mean ± standard deviation (s. d.). *P < 0.05, **P < 0.01, ***P < 0.001. Source data are provided as a Source Data file

