Fig. 6.
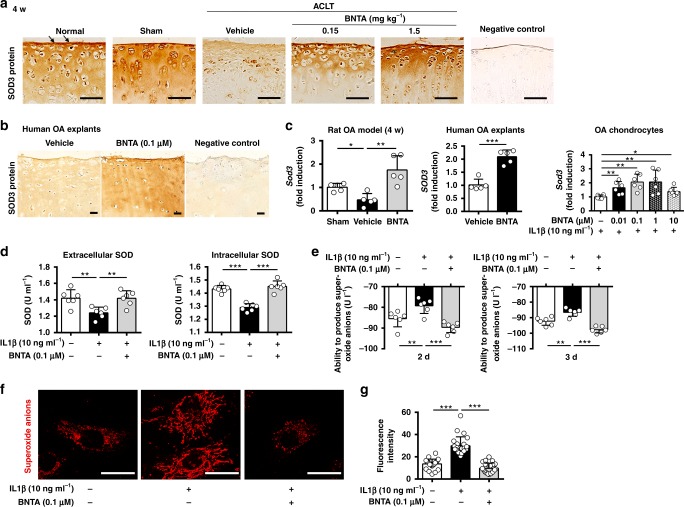
Superoxide dismutase 3 (SOD3) was the target of BNTA. a Representative images of immunostaining for SOD3 protein in normal, sham, vehicle, and BNTA-treated (0.15, 1.5 mg kg−1) rats at 4 w (brown, arrows; scale bar, 50 μm). b Immunostaining for SOD3 protein in human osteoarthritis cartilage explants after BNTA (0.1 μM) or vehicle incubation for 3 w (scale bar, 50 μm). c Quantification of mRNA levels for Sod3 in articular cartilage tissue of rat OA model after vehicle or BNTA (1.5 mg kg−1) treatment for 4 w (nonparametric test; n = 5 for each group), SOD3 in human OA cartilage explants after vehicle or BNTA (0.1 μM) treatment for 3 w (unpaired two-tailed Student’s t-test; n = 5 for each group), and Sod3 in interleukin 1 beta (IL1β, 10 ng ml−1)-induced rat OA chondrocytes after BNTA or vehicle treatment for 6 h (nonparametric test; n = 6 for each group). d The extracellular and intracellular SOD activities in rat primary chondrocytes after treated with IL1β (10 ng ml−1) or BNTA (0.1 μM) for 3 d (one-way ANOVA; n = 6 for each group). e The ability to produce superoxide anions of culture media in IL1β (10 ng ml−1)-induced rat OA chondrocytes incubated with BNTA (0.1 μM) for 2 d and 3 d, which was used to assess the extracellular superoxide anions content (one-way ANOVA; n = 6 for each group). f, g Representative staining images and quantitative assay of superoxide anions in IL1β (10 ng ml−1)-induced rat OA chondrocytes incubated with BNTA (0.1 μM) for 2 d, as assessed with MitoSOX Red staining (one-way ANOVA; n = 24 for each group). Scale bar, 25 μm. Data are shown as the mean ± standard deviation (s. d.). *P < 0.05, **P < 0.01, ***P < 0.001. Source data are provided as a Source Data file

