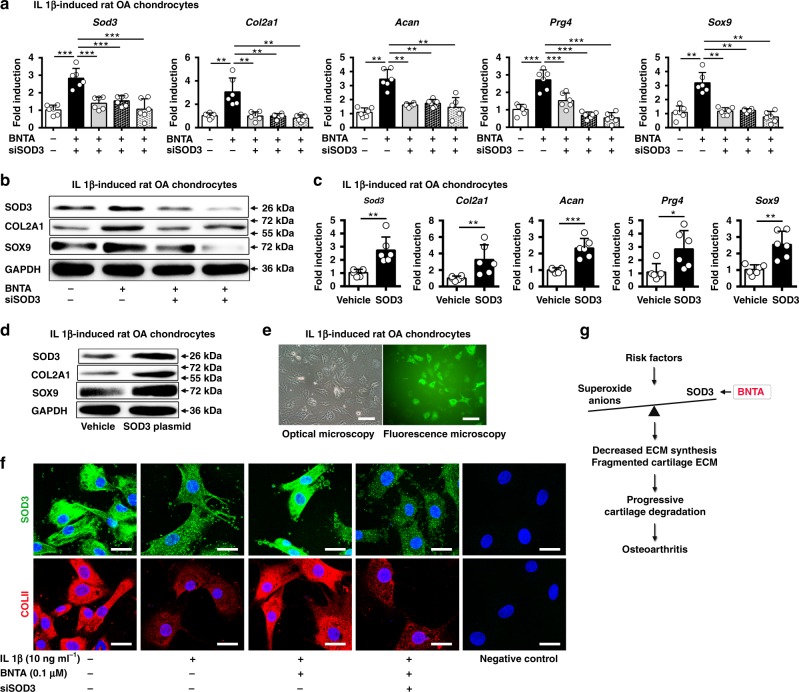
Fig. 7.
Identification of superoxide dismutase 3 (SOD3) as the target of BNTA. a Sod3, collagen type II alpha 1 chain (Col2a1), aggrecan (Acan), proteoglycan 4 (Prg4), and SRY-box 9 (Sox9) mRNA levels in interleukin 1 beta (IL1β, 10 ng ml−1)-induced rat osteoarthritis chondrocytes cultured with BNTA (0.1 μM) or three siSOD3s for 6 h, respectively (n = 6 for each group; Sod3, Prg4, one-way ANOVA; Col2a1, Acan, Sox9, nonparametric test). b The proteins levels of SOD3, COL2A1, SOX9, and glyceraldehyde-3-phosphate dehydrogenase (GAPDH) in IL1β (10 ng ml−1)-induced rat OA chondrocytes treated with BNTA (0.1 μM) or siSOD3s for 2d. c Sod3, Col2a1, Acan, Prg4, and Sox9 mRNA levels in IL1β (10 ng ml−1)-induced rat OA chondrocytes treated with vehicle or SOD3 plasmid for 2 d (n = 6 for each group; Sod3, Acan, and Sox9, unpaired two-tailed Student’s t-test; Col2a1 and Prg4, nonparametric test). d The proteins levels of SOD3, COL2A1, SOX9, and GAPDH were evaluated in IL1β (10 ng ml−1)-induced rat OA chondrocytes treated with or without SOD3 plasmid for 2 d. e Images of IL1β-induced rat OA chondrocytes under optical and fluorescence microscopy after incubation with SOD3 plasmid for 2 d (scale bar, 400 μm). f Immunofluorescence staining for SOD3 and COLII in rat primary chondrocytes cultured with IL1β (10 ng ml−1), BNTA (0.1 μM), or siSOD3 for 2 d. Scale bar, 25 μm. g The working model of how BNTA protects against OA development by activating SOD3. Data are shown as the mean ± standard deviation (s. d.). *P < 0.05, **P < 0.01, ***P < 0.001. Source data are provided as a Source Data file

