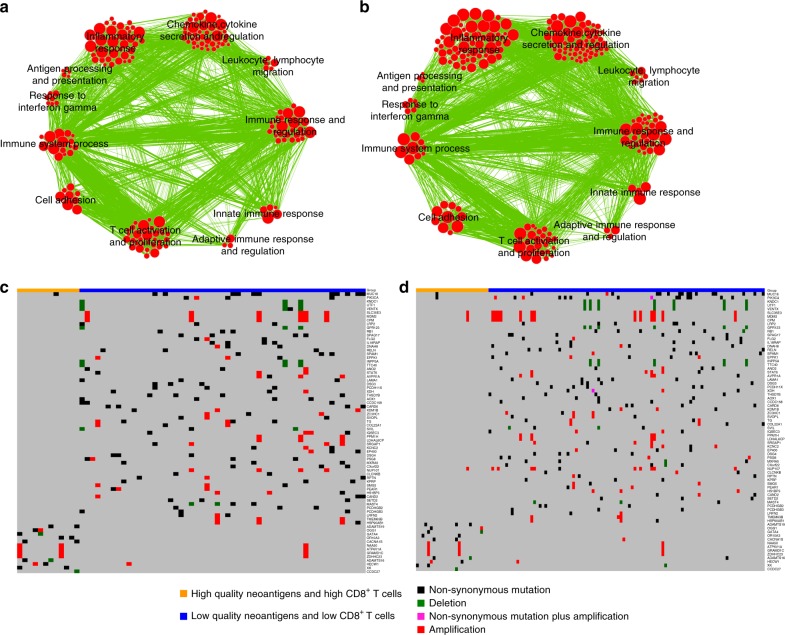
Fig. 5.
Gene ontology enrichment networks and genetic characteristics of IDH wild-type GBM with high-quality neoantigens and high CD8+ T cells. a Enrichment map network of statistically significant GO categories in the patient cohort analyzed by WES and RNAseq. b Enrichment map network of statistically significant GO categories in the patient cohort with WES and Agilent data available (normalized enrichment score, NES > 0.6, and q-value < 0.00001). Nodes represent GO terms and lines their connectivity. Node size is proportional to the number of genes in the GO category and line thickness indicates the fraction of genes shared between groups. c Landscape of somatic genomic alterations (non-synonymous mutations, copy number alterations) in IDH wild-type GBM (GBM cohort analyzed by WES and RNAseq). d Landscape of somatic genomic alterations (non-synonymous mutations, CNVs) in IDH wild-type GBM (GBM cohort analyzed by WES and Agilent microarrays). Rows and columns represent genes and tumor samples, respectively. Genomic alterations are indicated. Genes are sorted according to frequency (% patients) in patients having both high-quality neoantigens and high CD8+ T lymphocytes or patients having both low-quality neoantigens and low CD8+ T lymphocytes, respectively

