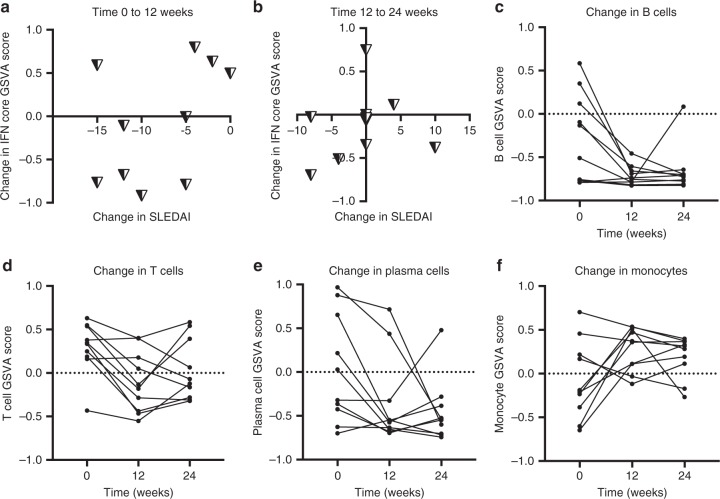
Fig. 7.
The IGS and SLEDAI do not change synchronously. Ten SLE patients with lupus nephritis and SLEDAI > 8 (GSE72747) and healthy controls (n = 46) from GSE39088 had Ftest differential expression analysis using time zero, 12 and 24 week whole blood samples. Treatment with high dose immunosuppressive was begun after time zero and continued for 12 weeks; at 12 weeks all patients were switched to lower dose/maintenance therapy. a, b Graphs show the change in SLEDAI versus the change in the IFN core signature GSVA enrichment score. c–f GSVA enrichment signatures corresponding to B cells, T cells, plasma cells, and monocyte cell surface (monocytes, Supplementary Data 12) were determined at each time-point and most patients had standard deviations >.2 between their zero and 12 week time-points. One-way ANOVA p values were <.05 for comparison of mean GSVA enrichment scores for B cells, T cells and Monocytes between time zero and 12 weeks. Tukey’s multiple comparison test between time zero and 12 weeks showed significant differences in mean GSVA enrichment scores for B cells (p = .02), T cells (p = .03) and monocytes (p = .05) but not plasma cells

