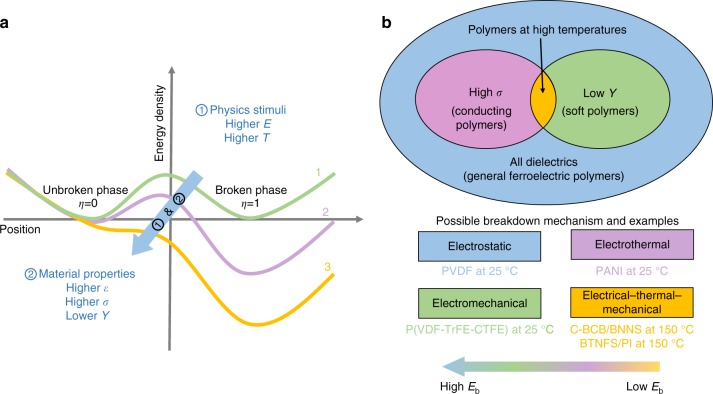
Fig. 4.
Schematic diagrams for understanding and classifying breakdown mechanisms. a Variation of the energy profile as function of the order parameter for polymers under physical stimuli. Each solid line denotes the double-well energy profile under different stimuli. The blue arrow signifies that the energy profile can be tilted by physics stimuli or changes of material properties. b Identification of breakdown mechanisms in polymer-based material systems. Examples of poly(vinylidene fluoride-hexafluoropropylene) (PVDF), poly(vinylidenefluoride‐trifluoroethylene‐chlorotrifluoroethylene) (P(VDF-TrFE-CTFE)), polyaniline (PANI), cross-linked divinyltetramethyldisiloxanebis(benzocyclobutene) BNNS composite (C-BCB/BNNS), and BaTiO3 nanofiber/polyimide (BTNFS/PI) are from experiments23–27. Different color regions represent possible breakdown mechanisms of different dielectrics. From the electrostatic breakdown (in blue) to electrical–thermal–mechanical breakdown (in yellow), the breakdown strength decreases

