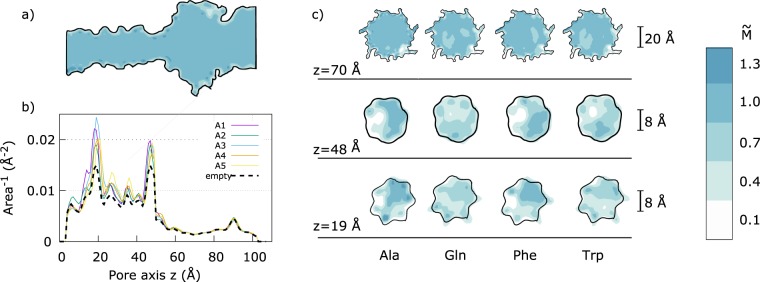
Figure 2.
Accessible volume estimation. (a) The panel report a cut of the 3D averaged occupancy map for the empty pore. Blue areas corresponds to region that are fully accessible by the electrolyte while white ones do not contribute to the volume useful for the ions transport between the two side of the membrane, . (b) Inverse of the accessible area, Az, along the pore. The empty pore profile is plotted as dashed black line. The two peaks at Å and Å correspond to the central αHL constriction and to the constriction close to the barrel entrance, respectively. The five solid lines refer to the five Ala replicas. (c) Slices of normal to the pore z-axis passing through the two constrictions (z = 19 Å and z = 48 Å) and the vestibule (z = 70 Å) for the four homopeptides.

