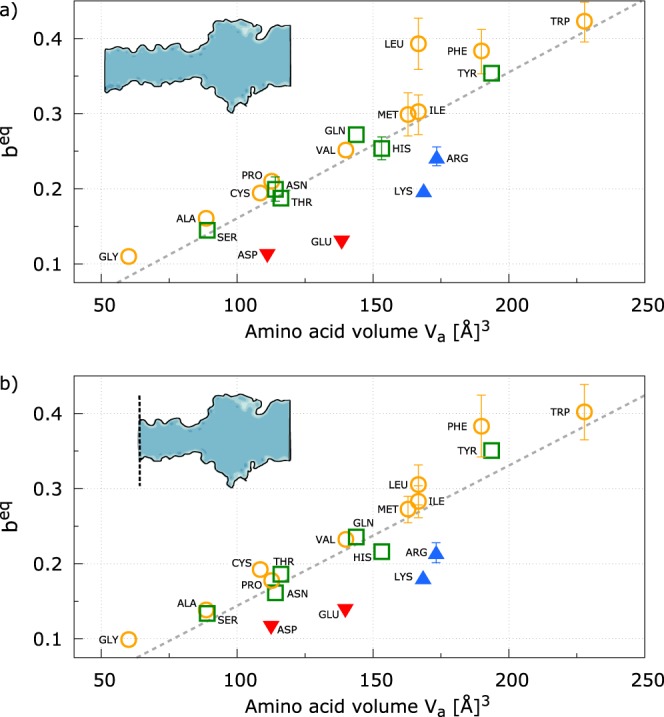
Figure 4.

Pore clogging estimator beq for all residues Vs the amino acid volume Va. Yellow circles corresponds to hydrophobic residues, green squares to polar, blue up-triangles to positively charged residues and red down-triangles to negatively charged ones. The dashed line is the minimum square fit. Panel a reports the beq calculated on the entire pore while panel b refers to the beq calculated removing the last part of the barrel including the secondary constriction, see the sketch in the inset. Error bars are estimated by considering beq from independent replicas as independent measurements and they are reported only when larger than symbols.
