Fig. 4.
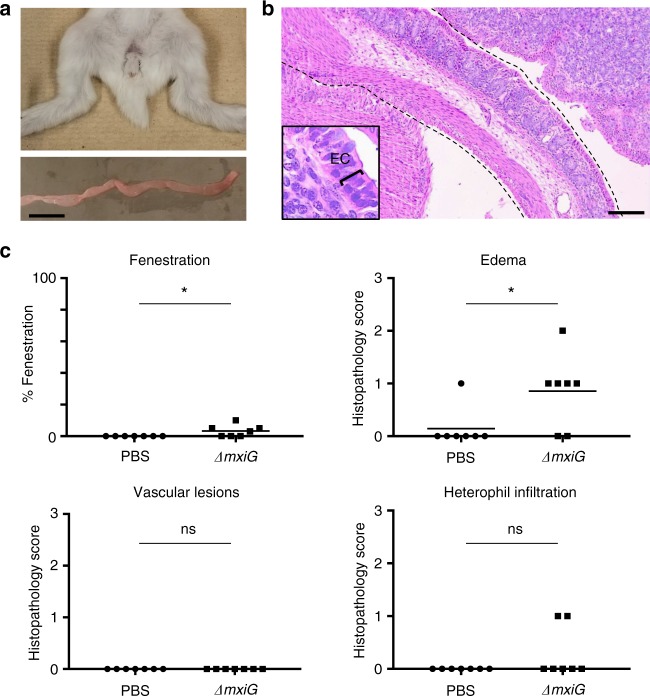
Symptoms and histopathology in absence of intracellular invasion. a Representative images of animals (top) and colon (bottom) inoculated with the ΔmixG mutant. Scale bar, 2 cm. b Representative image of hematoxylin- and eosin-stained colonic sections from animals inoculated with the ΔT3SS mutant. Dotted lines delineate the colon. Inset: high-magnification of epithelial cells (ECs). Scale bars, 100 μm. c Percentage of epithelial fenestration (EF), and histopthology scores of edema (E), vascular lesions (VLs), and heterophil infiltration (HI). Statistical analysis, unpaired t test. ΔmxiG vs. mock (phosphate-buffered saline (PBS)): EF, *P < 0.05; E, *P < 0.05; VL, ns; HI, ns (not significant). Source data are provided as a Source Data file

