Figure 2.
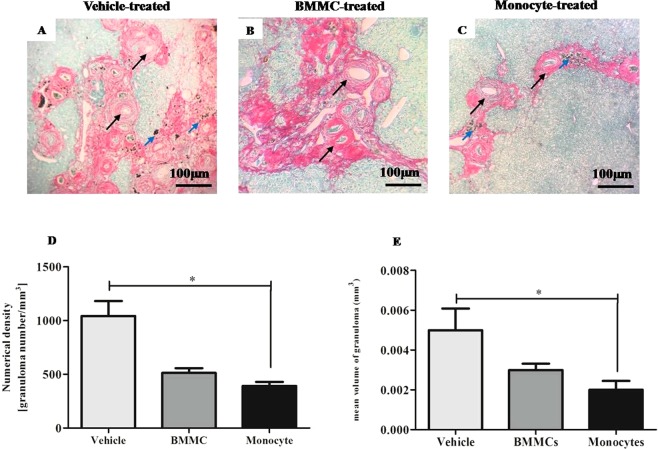
Reduction of granuloma number and volume after monocyte therapy. Liver sections sampled randomly and stained with Sirius red/fast green were examined by optical microscopy (100X magnification). Images of liver section of S. mansoni–infected mice 8 weeks after therapy with (A) vehicle, (B) Bone Marrow Mononuclear Cells (BMMCs) or (C) Monocytes, were digitalized and analyzed by morphometry for evaluation of (D) numerical density and (E) mean volume granulomas. Hepatic granulomas, well delimited and spherical shape which had the S. mansoni egg inside (black arrow) were considered during the measurement. Blue arrow – Schistosoma pigment. Values are presented as means ± S.E. (n = 6) *P < 0.05. Statistical analysis was performed by Kruskal-Wallis, followed by Dunn post-hoc test.

