Fig. 3.

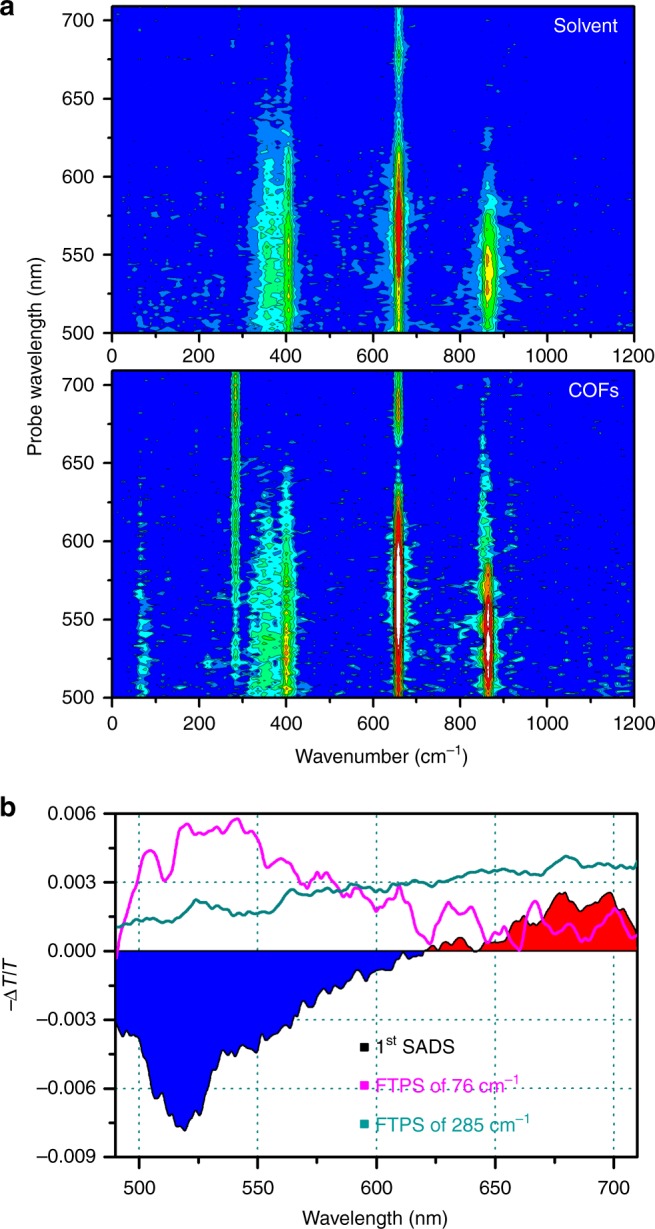
Wavelength-resolved Fourier transform power spectra. a Wavelength-resolved Fourier transform power spectra (FTPS) of neat DMF (top) and COFs dispersed in DMF (bottom) with the probe spectral window of 500–710 nm. The Fourier power spectra of COFs have peaks at 76 and 285 cm−1, which are absent in the FTPS of pure solvent. b Comparison of SADS (black) with the slices of wavelength-resolved FTPS at selected oscillation frequencies. In the SADS, the blue- and the red-shaded area indicate negative and positive amplitude of the TA signal, respectively. The amplitude of the 76 cm–1 oscillation is dominant in the spectral range of ground-state bleaching and stimulated emission of the first SADS, whereas the 285 cm–1 mode is manifested in the entire spectral range of probe pulse
