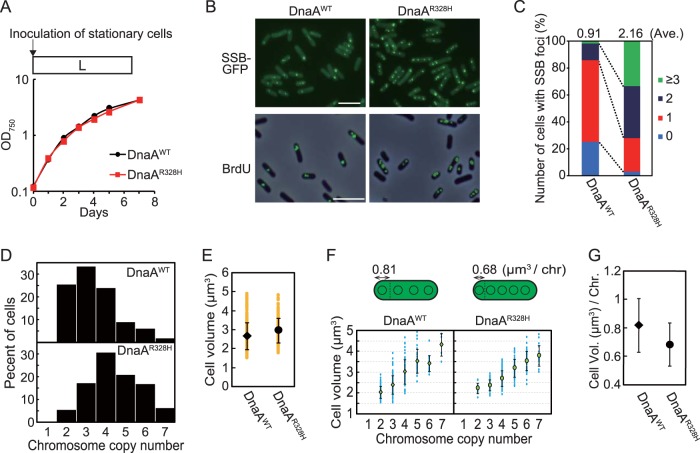
FIG 3.
Chromosome replication in HA-DnaAWT and HA-DnaAR328H cells under illumination. (A) To visualize replicating chromosomes by fluorescence microscopy, GFP-tagged SSB protein was expressed in DnaAWT and DnaAR328H cells. Mid-log-phase cultures were inoculated into fresh inorganic medium (hour 0) and cultured under illumination. Growth curves of DnaAWT (black) and DnaAR328H (red) cells are shown. (B) Fluorescence microscopic images showing replicating chromosomes in DnaAWT and DnaAR328H cells. In the upper panel, SSB-GFP was observed in living DnaAWT and DnaAR328H cells at hour 6. In the lower panel, newly synthesized DNA was visualized by immunofluorescence microscopy with the anti-BrdU antibody. Cells were labeled with BrdU for 1 h (hour 5 to 6) and then fixed for immunofluorescence staining. The phase-contrast and immunofluorescence images are merged. Bar, 5 µm. (C) Frequencies of cells exhibiting zero (blue), one (red), two (deep blue), or three or more (green) SSB-GFP foci in DnaAWT and DnaAR328H cultures at hour 6 (n ≥ 300 cells for each strain). The average number of SSB foci is indicated above the bars. (D) Histograms showing number of chromosomes per cell in DnaAWT and DnaAR328H cultures at hour 6. The number of chromosomes was determined based on micrographs of SYBR Green-stained cells. (E) Distribution of DnaAWT and DnaAR328H cell volumes at hour 6. Orange points represent volumes of single cells (n ≥ 300 cells for each strain). The black diamond (DnaAWT) and circle (DnaAR328H) represent the means, and the error bars represent the standard deviations (n ≥ 300 cells for each strain). (F) Distribution of DnaAWT and DnaAR328H cell volumes and chromosomal numbers at hour 6. Blue points represent single cells. The green diamond (DnaAWT) and circle (DnaAR328H) represent the means, and the error bars represent the standard deviations (n ≥ 300 cells for each strain). (G) Mean cell volume occupied by one chromosome in DnaAWT and DnaAR328H cells at hour 6. The black diamond (DnaAWT) and circle (DnaAR328H) represent the means, and error bars represent the standard deviations (n ≥ 300 cells for each strain).

