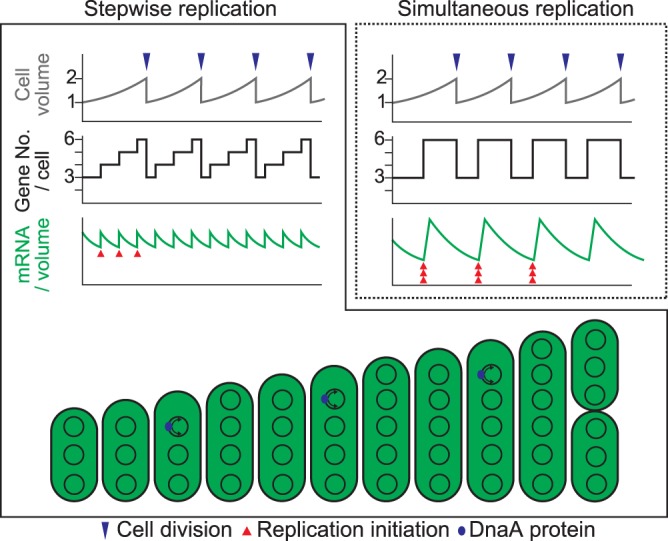
FIG 7.

Correlation between cell growth and chromosomal replication in S. elongatus. Schematic diagrams showing changes in cell volume (top), gene copy number per cell (middle), and mRNA level per unit volume (bottom) during cell growth in the case of stepwise (as observed in this study) or simultaneous replication of multicopy chromosomes. Blue and red arrowheads indicate cell division and replication of a chromosomal copy, respectively.
