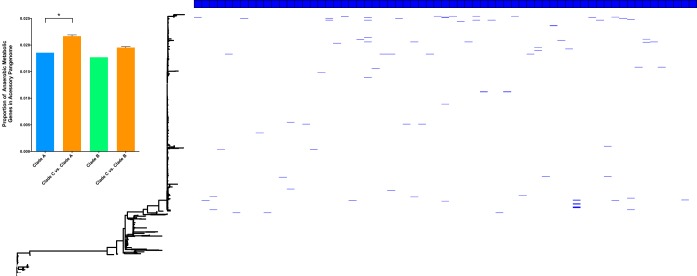
FIG 5.
Annotation of a maximum likelihood phylogeny of E. coli ST131, based on concatenated core CDS, with the presence of alternative alleles of 64 loci involved in anaerobic metabolism. Each blue box along the top of the tree annotation represents an individual anaerobic metabolism gene, and its presence in the ST131 population is indicated by a blue line. The inset is a bar chart displaying the proportions of the accessory pangenome that are occupied by genes involved in anaerobic metabolism for ST131 clade A, clade B, subsampled clade C versus clade A, and subsampled clade C versus clade B. P = 0.042 for clade C versus clade A and P = 0.086 for clade C versus clade B. Error bars represent standard errors of the means. Significance was determined using the median value P value from chi-square tests performed on random subsamples of the C clade.

