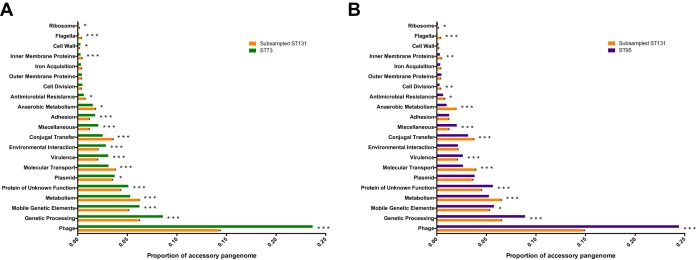
FIG 7.
Bar charts depicting the compositions of the accessory genomes of ST73 (A) and ST95 (B) compared to a repetitively sampled clade C ST131. The proportions of the accessory genome are plotted against manually assigned functional categories. Hypothetical proteins are responsible for the majority of the accessory pangenome and are omitted from the graphs. Error bars are standard errors of the means. Iterative chi-square tests were performed to assess significance, as described in Materials and Methods. *, P < 0.05; **, P < 0.01; ***, P < 0.001.

