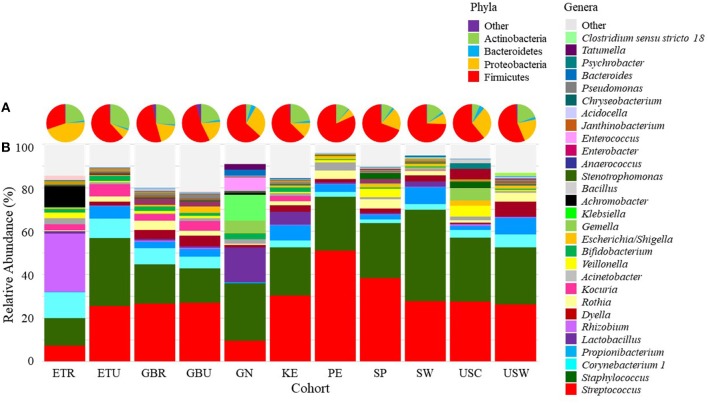
Figure 4.
Mean relative abundances of bacterial (A) phyla and (B) an aggregation of the 10 most-abundant genera in milk in each cohort. ETR, rural Ethiopia; ETU, urban Ethiopia; GBR, rural Gambia; GBU, urban Gambia; GN, Ghana; KE, Kenya; SP, Spain; SW, Sweden; PE, Peru; USC, California (United States); USW, Washington (United States).

