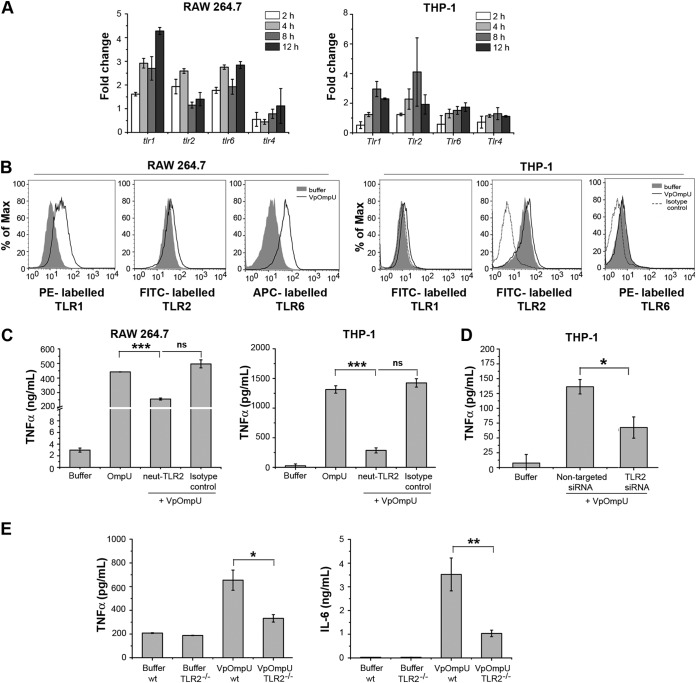
FIG 4.
The VpOmpU-mediated proinflammatory response is TLR2 dependent. (A) Upregulation of gene expression of TLR1, TLR2, and TLR6 at different time points in response to VpOmpU in RAW 264.7 cells and of TLR1 and TLR2 in THP-1 cells. Following treatment with VpOmpU, cells were harvested to isolate total RNA. cDNA was generated and subjected to RT-PCR. The CT values obtained were normalized to the respective CT values of the housekeeping genes. Fold change was calculated above buffer-treated cells, and results are expressed as mean ± SD from three independent experiments. (B) Increase in surface expression of TLR1, TLR2, and TLR6 in RAW 264.7 cells and of TLR1 and TLR2 in THP-1 cells in response to VpOmpU compared to the buffer-treated cells. Cells were treated with VpOmpU and analyzed for surface expression of TLRs by flow cytometry. (C) Decrease in TNF-α production upon TLR2 neutralization in VpOmpU-treated RAW 264.7 and THP-1 cells compared to the isotype-pretreated VpOmpU-treated cells and cells treated with only VpOmpU. Cells were pretreated with neutralizing antibody and the isotype for 1 h, followed by VpOmpU treatment for 24 h in RAW 264.7 cells and for 4 h in THP-1 cells. Supernatants were analyzed for TNF-α by ELISA. Results are expressed as mean ± SEM from three independent experiments (*, P < 0.05; **, P < 0.01; ***, P < 0.001; ns, P > 0.05 [versus cells treated with VpOmpU only]). (D) Decrease in TNF-α production in response to VpOmpU upon knockdown of TLR2 by siRNA in VpOmpU-treated THP-1 cells compared to the nontargeted siRNA-treated VpOmpU-treated cells. Following siRNA knockdown, cells were treated with VpOmpU for 4 h, and supernatant was analyzed for TNF-α by ELISA. Results are expressed as mean ± SEM from three independent experiments (*, P < 0.05; **, P < 0.01; ***, P < 0.001; ns, P > 0.05 [versus nontargeted siRNA-transfected VpOmpU-treated cells]). (E) Decrease in TNF-α and IL-6 production by VpOmpU-treated BMDMs differentiated from TLR2−/− mice compared to the wild-type control. Results are expressed as mean ± SEM from three independent experiments (*, P < 0.05; **, P < 0.01; ***, P < 0.001; ns, P > 0.05 [versus VpOmpU-treated cells from wild-type mice]).

