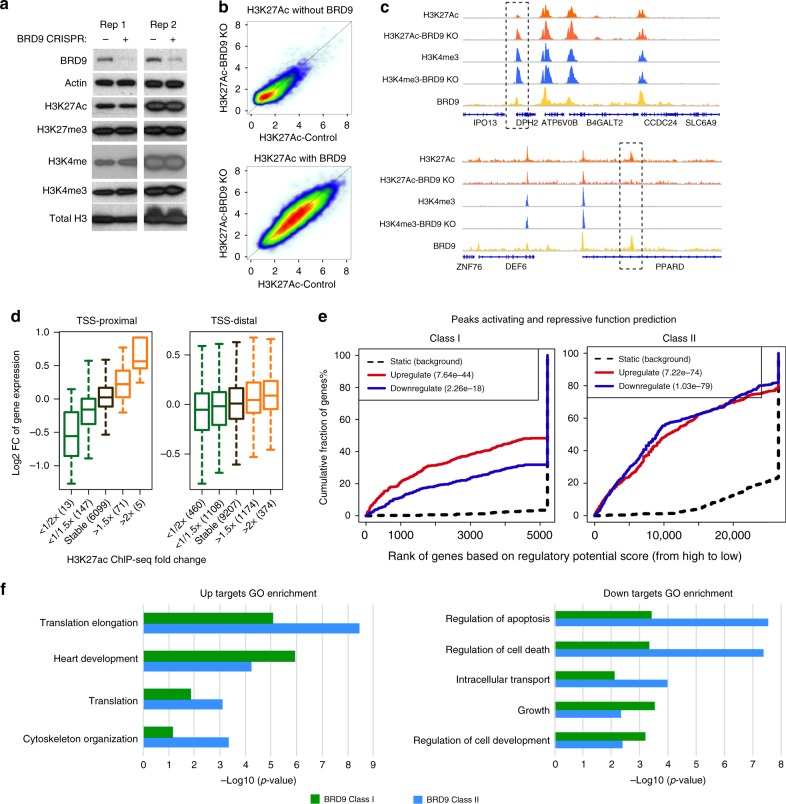
Fig. 5.
BRD9 directly regulates gene expression. a Western blot of selected histone modifications in G401 cells with or without BRD9. b, c Scatterplot of the average H3K27Ac (b) and H3K4me3 (c) ChIP-seq signals in H3K27Ac-WT and H3K27Ac-KD BRD9 over BRD9 binding sites. Loss of BRD9 leads to bidirectional changes of H3K27Ac and H3K4me3. d Correlation between the closest gene expression changes with H3K27ac signal changes at TSS-proximal and TSS-distal regions upon BRD9 deletion. In the box plots, bounds of the box spans from 25 to 75% percentile, the center line represents median, and whiskers visualize 5 and 95% of the data points. e BETA activating/repressive function prediction of the BRD9 class I and class II peaks in G401 cell. The red and the purple lines represent BRD9 upregulated and downregulated genes, respectively. The dashed line indicates the non-differentially expressed genes as background. Genes are cumulated by the rank on the basis of the regulatory potential score from high to low. The regulatory potential in the x-axis represents the likelihood of a gene being regulated by BRD9, calculated by considering both the number of BRD9 binding sites and the distance between gene TSS and the BRD9 peak (see details from methods). P- values that represent the significance of the upregulated or downregulated gene group distributions are compared with the static gene group by the Kolmogorov–Smirnov test. f GO terms enrichment of BRD9 class I and BRD9 class II direct up (left) and down (right) target genes upon BRD9 deletion

