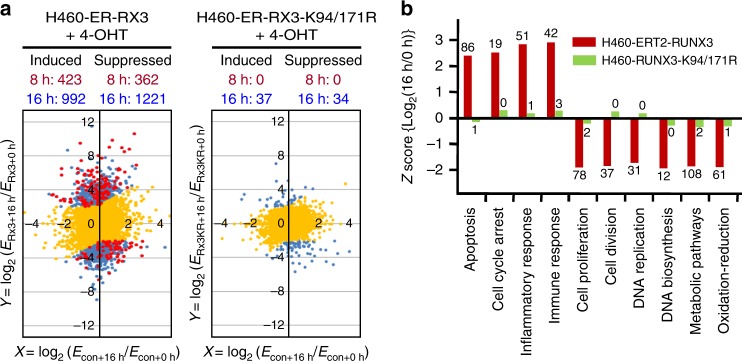
Fig. 10.
The R-point governs multiple programs of tumor suppression. a H460-vec, H460-ERT2-RUNX3, and H460-ERT2-RUNX3-K94/171R cells were serum-starved for 24 h, and then stimulated with 10% serum or 10% serum + 1 μM 4-OHT for 0, 8, or 16 h. RNA was extracted from the cells, and gene expression patterns were analyzed by mRNA sequencing. Expression of genes 8 or 16 h after serum stimulation was quantified as log2(fold change) relative to the average of control reactions (i.e., before serum stimulation, 0 h) for each cell line. Differential gene expression in response to expression of wild-type RUNX3 was analyzed by plotting log2(ERx3 + 16 h/ERx3 + 0 h) and log2(Evec + 16 h/Evec + 0 h); the results are shown on the left. Differential gene expression changes in response to expression of RUNX3-K94/171R were analyzed by plotting log2(ERx3KR + 16 h/ERx3KR + 0 h) and log2(Evec + 16 h/Evec + 0 h); the results are shown on the right. ERx3 + 16 h and ERx3 + 0 h, ERx3KR + 16 h and ERx3KR + 0 h, and Evec – 16 h and Evec – 0 h are the average expression levels of genes 0 or 16 h after 4-OHT stimulation in H460-ERT2-RUNX3, H460-ERT2-RUNX3-K94/171R, and H460-vec cells, respectively. Yellow spots indicate genes regulated in a RUNX3-independent manner. Red and blue spots indicate genes regulated in a RUNX3-dependent manner 8 and 16 h after 4-OHT stimulation, respectively (FDR < 0.001, p < 0.05). b RUNX3-dependent genes involved in various signaling pathways were analyzed using the DAVID Bioinformatics Resources 6.837. Gene expression levels 16 h after 4-OHT stimulation in the indicated cells were quantified as the fold change relative to the average of un-stimulated levels. Z-scores of log2(ERx3 + 16 h/ERx3 + 0 h) and log2(ERx3KR + 16h/ERx3KR + 0 h) for major signaling pathways are shown for H460-ERT2-RUNX3 and H460-ERT2-RUNX3-K94/171R cells. Numbers at the top or bottom of the bars indicate the numbers of genes significantly up- or downregulated by inducer treatment. All categories were enriched with p < 0.05

