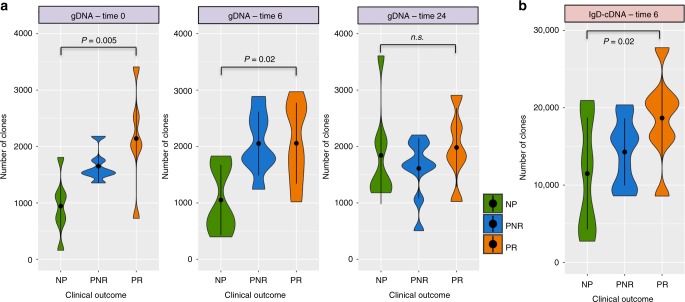
Fig. 2.
Violin plots showing the number of clones (richness) across the three clinical outcomes. a Number of clones at time 0, 6, and 24 from gDNA samples. b Number of clones at time 6 for the IgD isotype from cDNA samples. The P-values are obtained from the adjustment of a linear regression model considering the number of clones as a dependent variable and clinical outcome as an independent factor variable (n = 27 samples). Violin plots represent the probability density of the data at each value. The dot marker represents the median value with the interquartile range. Source data is provided as Source Data File

