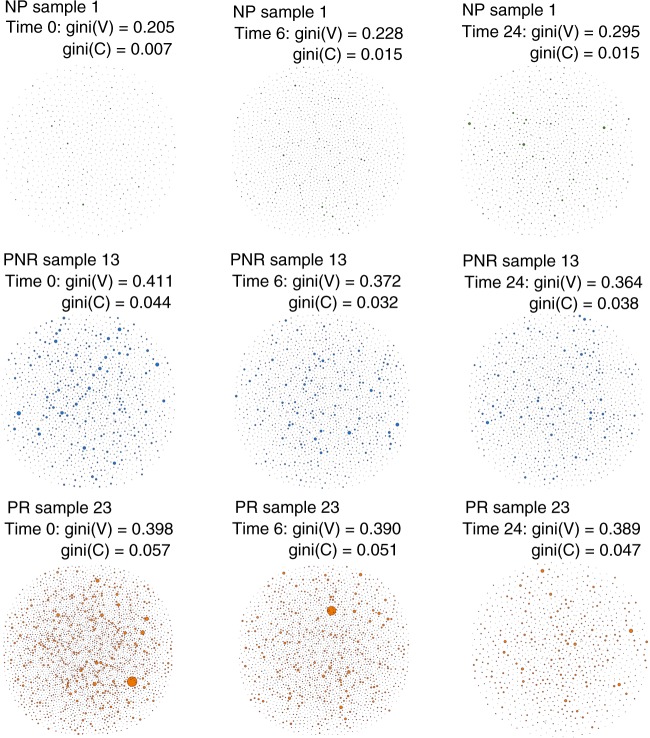
Fig. 4.
B-cell repertoire networks from three individuals representing the three clinical outcomes across time points. Each vertex represents a unique BCR being the vertex size defined by the number of identical BCRs considering the nucleotide sequences. An edge exists between vertices when they belong to the same clone as defined before, so clusters are groups of interconnected vertices forming a clone. Each sample shows the gini index obtained for the vertex size (Gini(V)) and cluster size (Gini(C)). BCR reflects the total B-cell receptors for that specific sample and clones reflect the total number of unique clones. Source Data is provided as Source Data File

