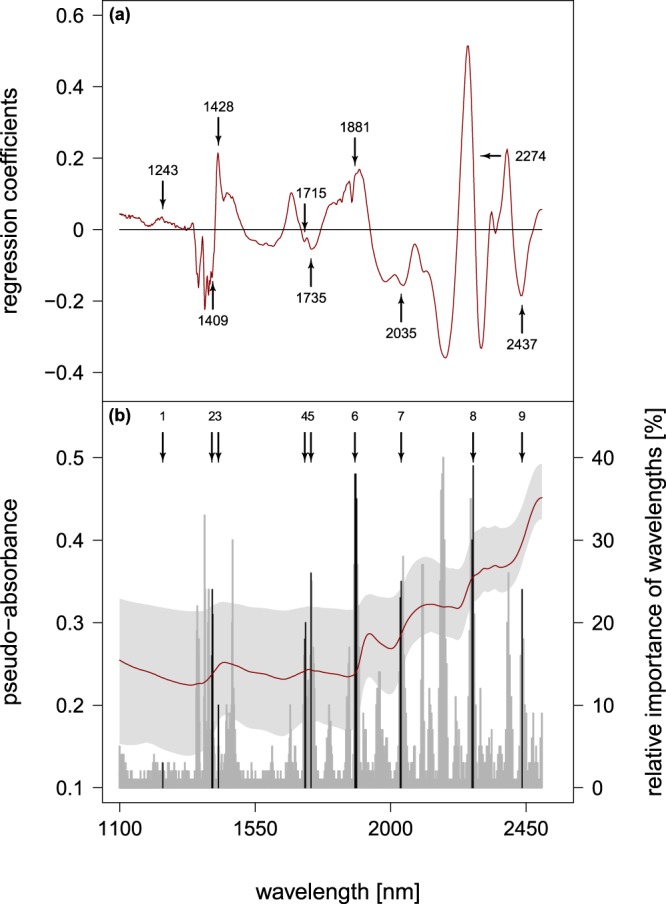
Figure 2.

(a) Regression coefficients from full spectrum PLS (red line) with the selected wavelengths from the best CARS-PLS model as overlay (black arrows with wavelength indicated). (b) Mean absorbance spectrum of fine roots (red line) and its range (light grey) together with the relative importance (in %) of wavelength selection during 100 runs (dark grey bars) and the most important variables from the best model (black bars). Black arrows and number refer to the wavelength clusters indicated by the most important selected variables.
