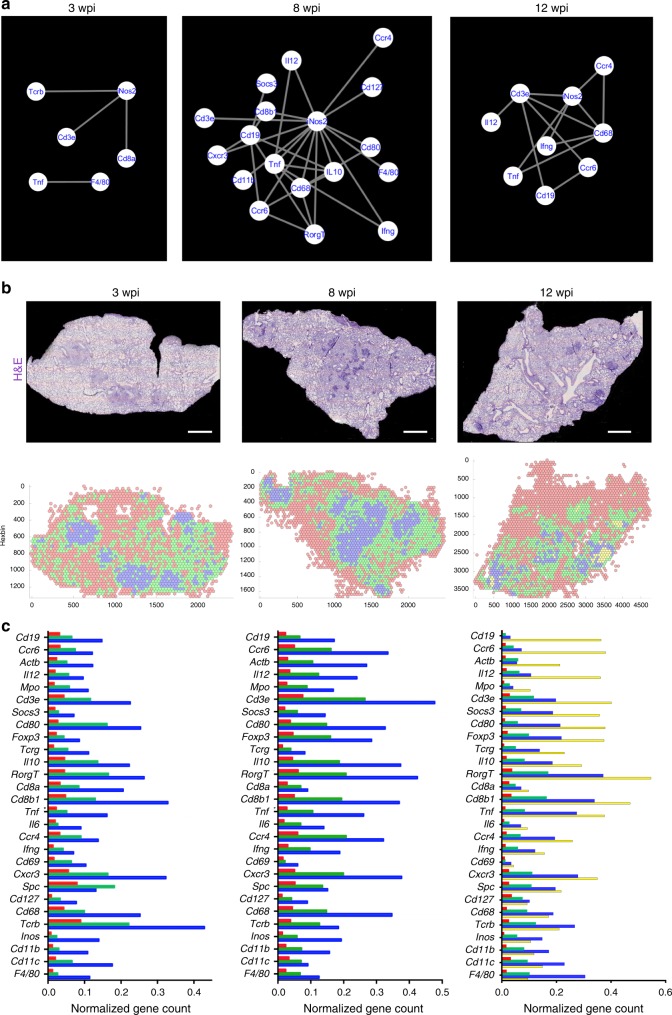
Fig. 2.
Maturation of the granuloma. a The spatial co-expression relationships between the in situ sequencing data were converted into network-based visualization, where each unique transcript is a node in the network and edges represent the interactions using InsituNet. To identify spatially co-expressed transcripts, InsituNet analyzed the co-occurrence of transcript detections within 30 pixels (10 μm). Euclidean distance for each pairwise combination of transcripts (see Supplementary Table 1 as example). Representative examples of one lesion per time point as defined in Supplementary Fig. 1 were selected. The significantly co-expressed sequences that are common in the same lesion from at least two consecutive sections are here depicted. Actb mRNA was excluded from network analysis due to broad expression in different cellular populations. b The tissue section plane was uniformly tiled into 200 pxls (70 μm) radius hexagons and the density of the multiple sequences in each hexagon was aggregated by binning and displayed into a 2D-hexbin map. The densities of the sequences were organized by clustering the hexagons into 3 (3 and 8 wpi) or 4 (12 wpi) different expression patterns. The H&E staining of one representation lung section and their hexbin maps at 3, 8, and 12 wpi are shown. Scale: 1000 μm. c The mean centroid normalized transcript counts in each hexagon was compared for the different clusters. The color-code used for the bars corresponds to that in the 2D-hexbin map. Note that the red clusters corresponding to unaffected areas contained less counts for of all specific sequences. Note also at 12 wpi that although some sequences were dominant in single clusters (i.e., Cd19 mRNA in the yellow cluster), other sequences were more evenly distributed, or predominated in the blue clusters. Source data are provided as a Source Data file

