Fig. 4.
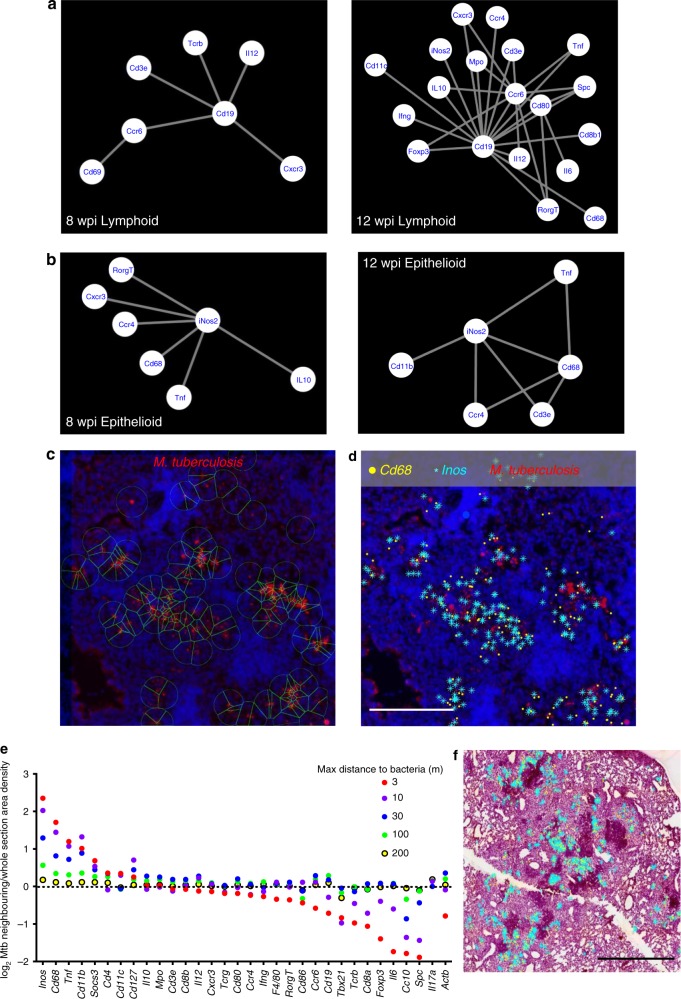
Identification of transcripts co-localizing with M. tuberculosis in tissue sections. a The networks of co-expressed transcripts in one representative lymphoid area of granulomas at 8 and 12 wpi are shown. b The networks of co-expressed transcripts in one representative epithelioid area of granulomas at 8 and 12 wpi are shown. c The auramine–rhodamine-stained M. tuberculosis bacteria were aligned with in situ transcript signals in tissue sections at 8 wpi. M. tuberculosis bacteria were identified by an automated cellprofiler pipeline and a 30 μm radius around those identified is depicted. d The Inos and Cd68 transcript signals at <30 μm from identified M. tuberculosis bacteria are shown together with M. tuberculosis and DAPI staining for the same selected region as in c. Scale bar: 200 μm. e The sequences located within a 3, 10, 30, 100, and 200 μm radius from M. tuberculosis bacteria were identified. The frequency of each sequence within a given distance was determined in relation to the total transcript count for that distance. The fold increase of this frequency with respect to that observed for the total lung section is depicted. Thus, whether a certain transcript is over- or under-represented within the defined distances from M. tuberculosis was determined. f The Cd68 and Inos transcripts located at <30 μm are shown aligned with the H&E staining of one representative section (of three sections). Note that most of the extracted sequences are present in the epitheloid region in relative proximity to the lymphoid areas. Scale bar: 1000 μm. Source data are provided as a Source Data file

