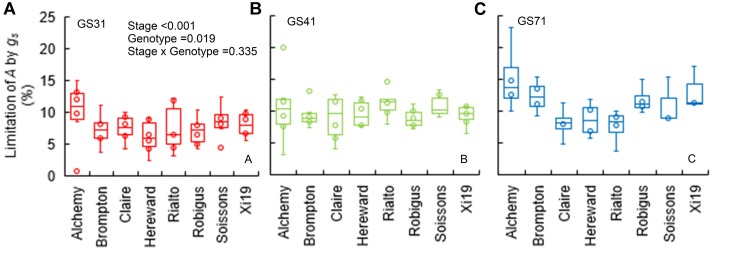
FIGURE 3.
Limitation of A by gs (gslimitA) after 30 min of the step change from low to high light (100 to 1500 μmol m-2 s-1 PPFD) assessed for eight wheat genotypes over three key stages of development (GS31, GS41, and GS71 as A–C respectively). Data were estimated by assuming a hypothetical A if no stomatal limitation was present immediately after a low to high light transition. Data were analyzed using two-way ANOVA [means separation was carried out with Duncan’s test (Supplementary Table S1)]. Data are means (n = 4–7).

