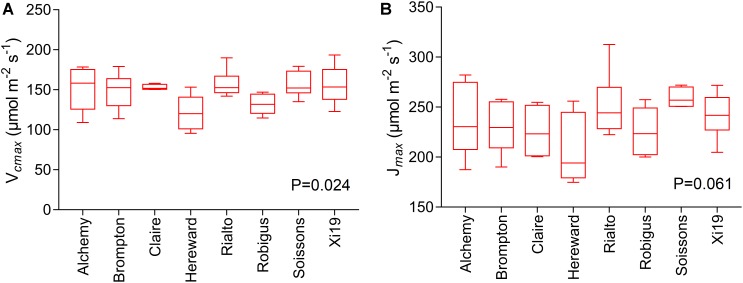
FIGURE 6.
Measures of photosynthetic capacity for the flag leaf of the wheat panel at GS41-45, estimated through A/Ci curves for eight wheat varieties. Data are means (n = 5–6 ± standard error of the means). (A) The maximum velocity of Rubisco for carboxylation (Vcmax). (B) The maximum rate of electron transport demand for RuBP regeneration (Jmax).

