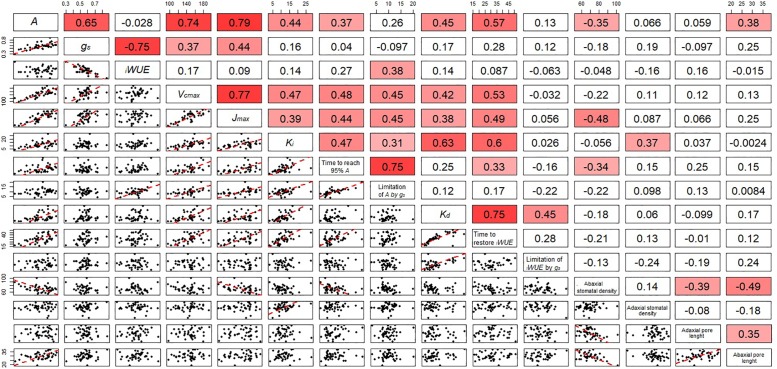
FIGURE 7.
Correlation matrix including the correlation coefficient between parameters describing the temporal response of gs during opening and closing, photosynthetic capacity and anatomical features for stomata of the flag leaf of wheat plants at GS41. In the bottom panels, regression was fitted by using major axis regression. Fitting line is shown only when the correlation was significant (P < 0.05).

