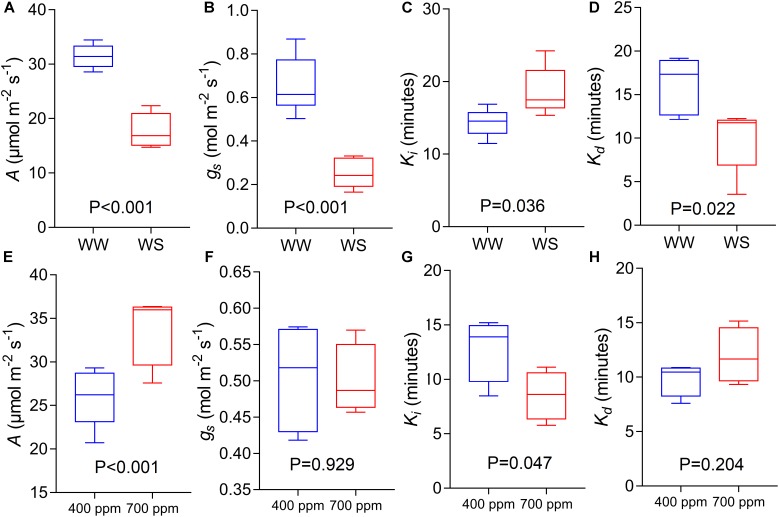
FIGURE 8.
CO2 assimilation rate at saturating light after 60 min of induction at 1500 μmol m-2 s-1 PPFD (A,E, A), stomatal conductance at saturating light after 60 min of induction at 1500 μmol m-2 s1 PPFD (B,F, gs), time constant for stomatal opening (C,G, Ki), and time constant for stomatal closing (D,H, Kd) estimated from step-changes in light collected in Experiments 2 and 3 (well-watered conditions and reduced water availability, WW and WS respectively, A–D; ambient and elevated atmospheric [CO2] conditions, 400 and 700 μmol mol-1 respectively, E–H) collected at GS45-51 and GS31 respectively on cv. Soissons. Data were analyzed with one-way ANOVA and shown as means (n = 4–6 ± standard error of the means).

