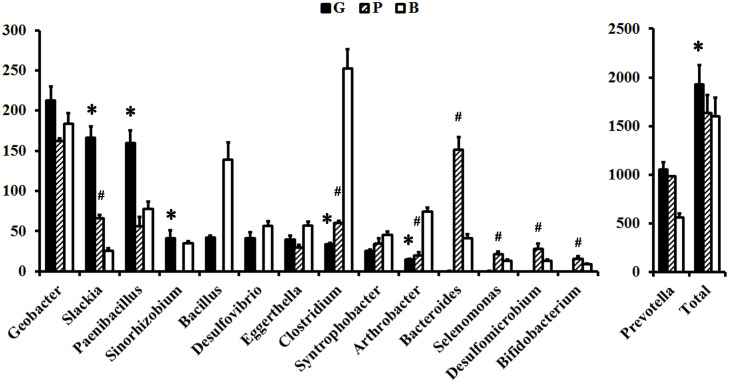
FIGURE 3.
Comparisons of the relative abundance of major contributors to F-types ATPase between the groups. The relative abundance was normalized to 1,000,000 for each sample. “∗” indicates the significant change between the G and B groups. “#” indicates the significant change between the P and B groups.

