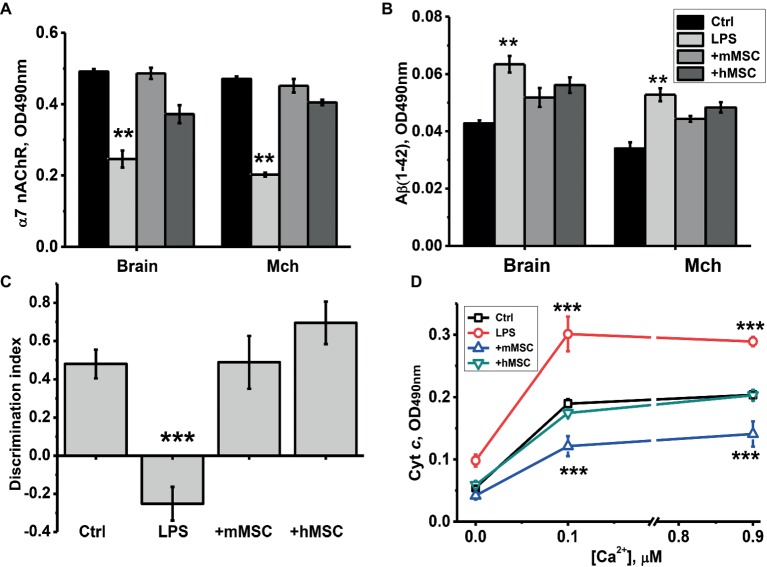
Figure 2.
The effect of either hMSCs or mMSCs on α7 nAChR (A) or Aβ (1–42) (B) levels in the brain, memory impairment (C) and cyt c release from the brain mitochondria (Mch) under the effect of Ca2+ (D). Ctrl – samples of non-treated mice. Each column (A–C) or point (D) corresponds to M ± SD of data for separate mice in each group (n = 8). **p < 0.005; ***p < 0.0005 compared to Ctrl. Designations of columns are similar in (A) and (B).

