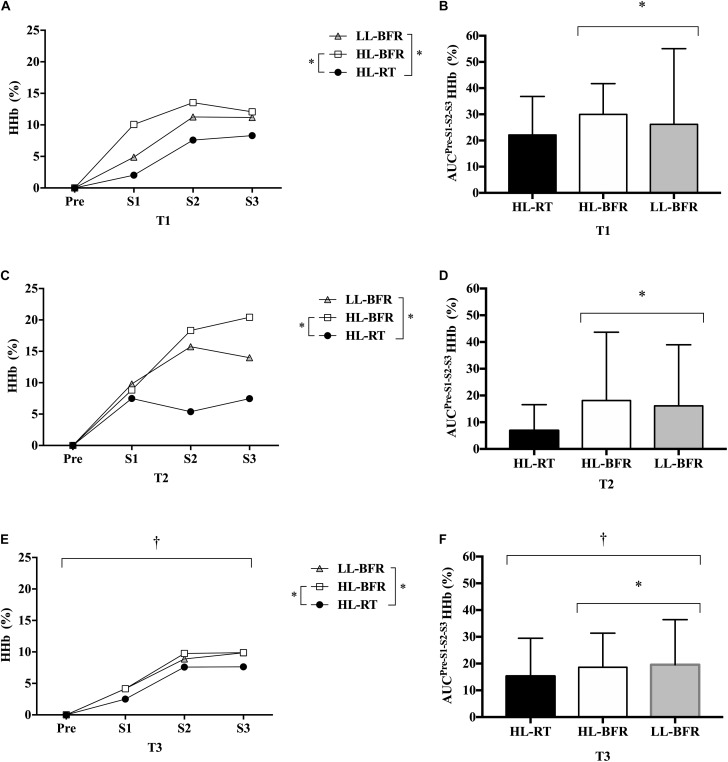
FIGURE 3.
Normalized deoxygenated hemoglobin ([HHb]) values from the resistance training session (Pre [Before the beginning of the exercise], set 1 [S1], set 2 [S2], and set 3 [S3]) at baseline (T1, A), after 5 (T2, C) and 10 weeks (T3, E) for the high-load resistance training (HL-RT), high-load resistance training with blood flow restriction (HL-BFR) and low-load resistance training with blood flow restriction (LL-BFR) protocols. [HHb] values also are reported as area under the curves (AUC) from the entire resistance training session at T1 (B), T2 (D), and T3 (F) for the HL-RT, HL-BFR, and LL-BFR protocols. ∗Significantly different from HL-RT (main protocol effect, P < 0.04). †Significant different from T2 (main time effect, P < 0.04). Values presented as mean ± SD.

