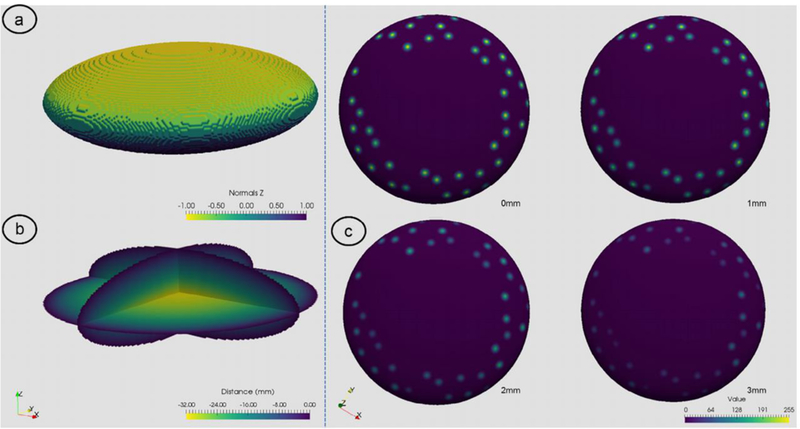
Figure 1.

Visualization of 3D ellipsoid used for measurement validation. (A) shows a 3D contour of the surface of the ellipsoid colored based upon the z values of the surface normals; (B) the signed-distance transform colored by distance from the ellipsoid surface; (C) the UPI surface extracted based on the surface normals values with following the 3D jet data added to the ellipsoid. In this example, 40 jets were randomly placed on the surface and then visualized at 0 to 3mm from the boundary.
