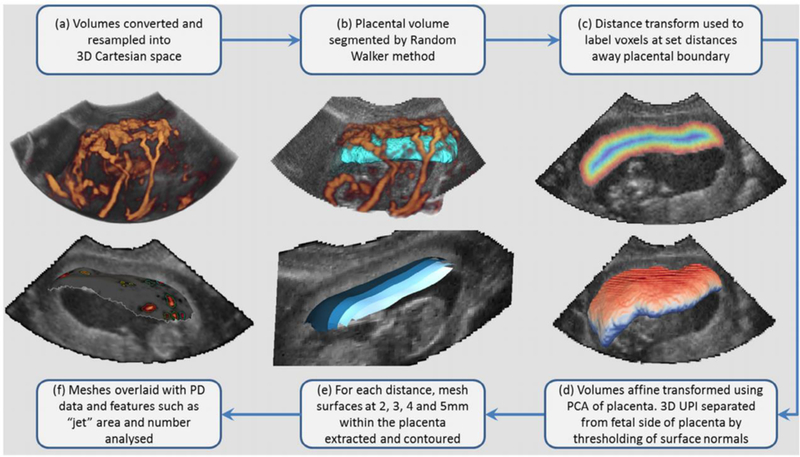
Figure 2.

Workflow of image processing method to generate 3D meshes for analysis of power Doppler (PD) signal at specific distances on the maternal side of the placenta. From clockwise: 3D PD volume rendering following conversion of data showing PD (orange) and B-Mode (greyscale) (A). Placental volume (teal) with PD rendering and 2D B-Mode slice (B). Distance transform (multicolor) based on millimetre distance away from placental boundary (C). 3D placenta volume color mapped based on surface normal of single axis where blue indicates the fetal side and red the maternal (D). 3D surfaces colored from blue to white representing each of the four distances within the placenta analyzed converted from voxel to mesh data (E). Finally, a 2mm mesh is shown with PD data overlaid upon the surface and each closed PD signal above the noise threshold outlined as a specific region of interest (F).
