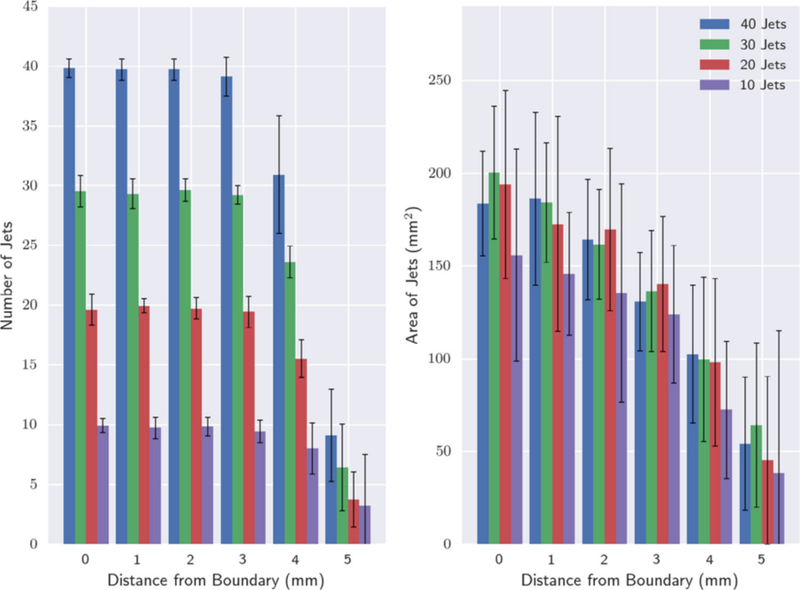
Figure 3.

Graph showing number of jets and mean areas measured in the set of 3D ellipsoid computer-generated phantoms with 10 to 40 generated jets. (A) Number of discrete areas measured at distances 0 to 5mm from the ellipsoidal boundary. (B) Mean area as measured for each identified jet measured at 0 to 5mm from the boundary.
