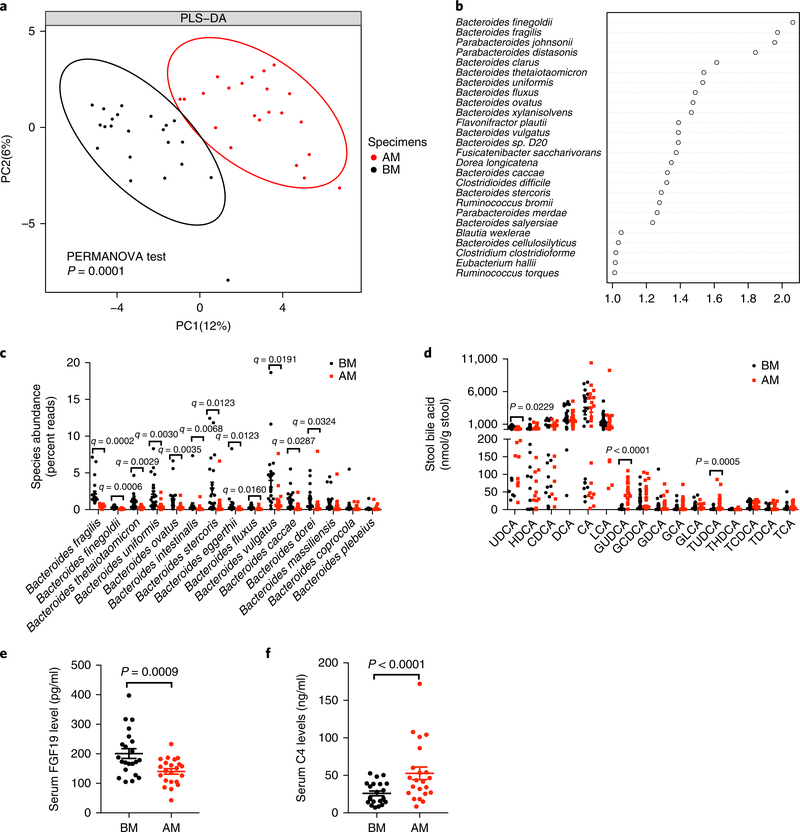
Fig. 1 |. Oral metformin modulates the composition of gut microbiota and bile acids in individuals with T2D.
a, Partial least-square discriminant analysis (PLS-DA). The BM (before the metformin treatment) group is shown in black, and the AM (after 3-d metformin treatment) group is shown in red. PC1 and PC2 account for 12% and 6%, respectively, of the total variance. PERMANOVA with the Bray–Curtis distance was used to assess the significant difference between the two groups, and the result showed significant separation of the BM and AM groups (P = 0.0001). n = 22 individuals/group. b, VIP scores of PLS-DA. VIP scores were used to rank the ability of different taxa to discriminate between BM and AM groups. A taxon with VIP score >1 was considered important in the discrimination. n = 22 individuals/group. c, Different species abundance (percent reads) of Bacteriodes based on metagenomics data. n = 22 individuals/group. q value (FDR-adjusted P value), P value determined by two-tailed Wilcoxon matched-pairs signed rank test. d, Bile acid levels in the stool. n = 22 individuals/group. P value was determined by two-tailed Wilcoxon matched-pairs signed rank test. e,f, Serum FGF19 (e) and C4 (f) levels. n = 22 individuals/group. P value was determined by two-tailed Wilcoxon matched-pairs signed rank test. All the data are presented as the mean ± s.e.m.

