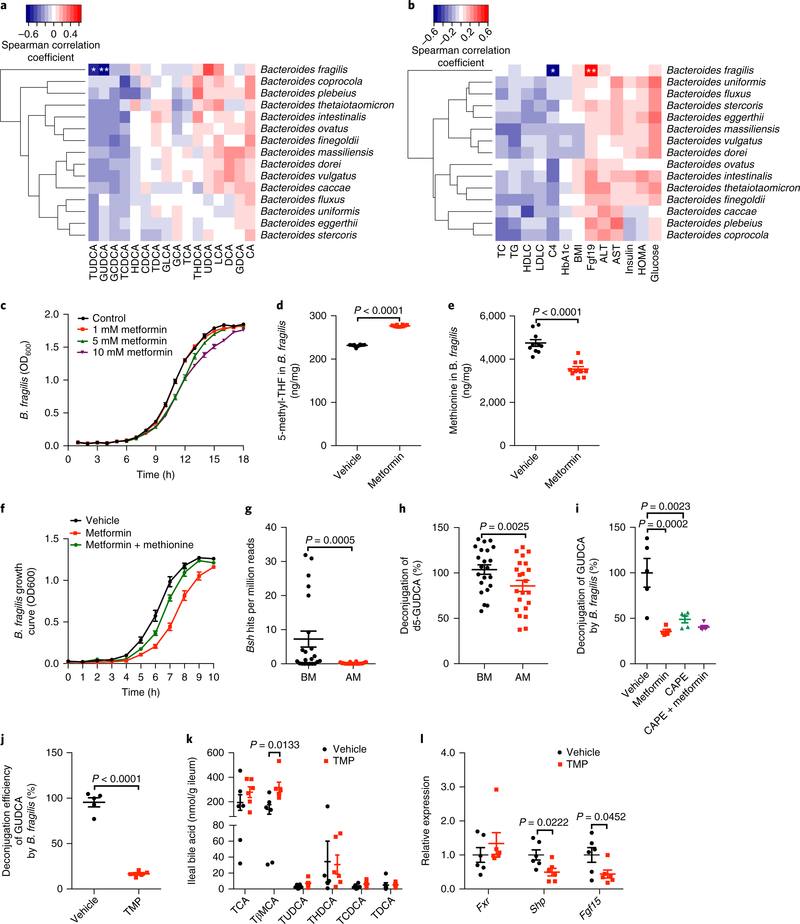
Fig. 3 |. Metformin-induced downregulation of B. fragilis abundance was negatively correlated with the modulation of bile acid profiles.
a, Heat map of the correlation between the species of Bacteroides and the bile acid levels in the stool of individuals with T2D in response to metformin treatment. b, Heat map of the correlation between the species of Bacteroides and biochemical indexes in individuals with T2D in response to metformin treatment. n = 22 individuals/group. Spearman’s rank test. *q < 0.05, **q < 0.01 versus BM, q value (FDR-adjusted P value). c, Growth curve of B. fragilis with or without metformin in a laboratory culture. n = 9 replicates/treatment. d,e, The content of 5-methyl-tetrahydrofolic acid (5-methyl-THF (d) and methionine (e) in B. fragilis treated with and without metformin or in a laboratory culture. n = 10 replicates/treatment. P value was determined by two-tailed Student’s t-test (d, t18 = 43.34; e, t18 = 6.249). f, Reconstitution with methionine restored the growth of B. fragilis in the presence of metformin in culture. n = 5 replicates/treatment. g, The abundance of Bsh gene of B. fragilis in individuals with T2D. n = 22 individuals/group. P value was determined by two-tailed Wilcoxon matched-pairs signed rank test. h, The hydrolysis efficiency of d5-GUDCA by stool samples from individuals with T2D before (BM) and after (AM) metformin treatment. n = 22 individuals/group. P value was determined by two-tailed Wilcoxon matched-pairs signed rank test. i, The hydrolysis efficiency of GUDCA mediated by vehicle- and metformin-treated B. fragilis with or without caffeic acid phenethyl ester (CAPE, BSH activity inhibitor) in culture. n = 5 replicates/treatment. P values were determined by one-way ANOVA with Tukey’s correction (F3,16 = 13). j, The hydrolysis efficiency of GUDCA mediated by B. fragilis with or without TMP in culture. n = 5 replicates/treatment. P value was determined by two-tailed Student’s t-test (t8 = 15.2). k,l, Bile acid levels (k) and the relative expression of Fxr and its target genes (l) in the ileum after 1 week of TMP treatment on a HFD. n = 6 mice/group. P values were determined by two-tailed Student’ t-test (TβMCA: t10 = 3, Shp: t10 = 2.703, Fgf15: t10 = 2.288). All data are presented as the mean ± s.e.m.

