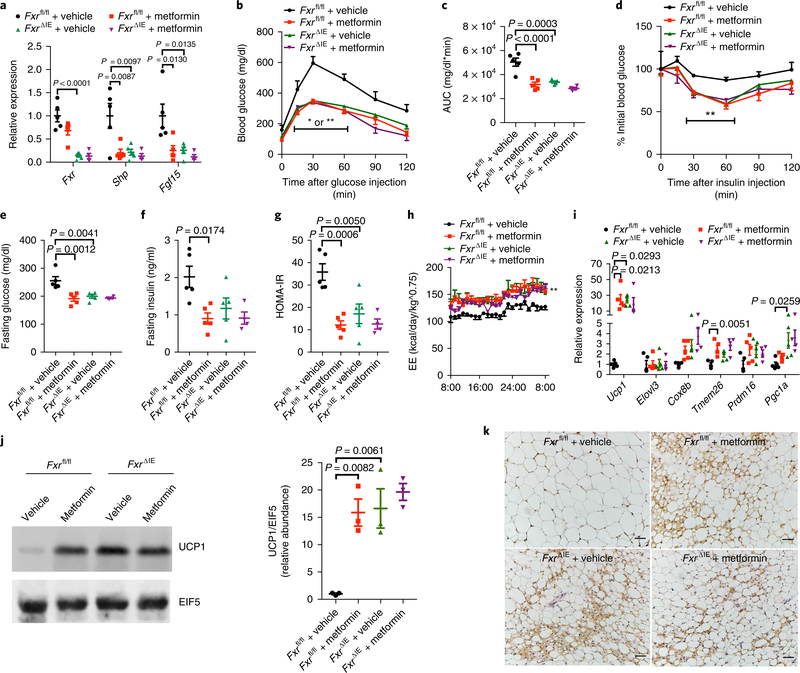
Fig. 5 |. Intestinal FXR signaling is essential for the metformin-induced long-term improvements in metabolic diseases.
HFD-fed Fxrfl/fl and FxrΔIE mice were treated with metformin for 12 weeks. a, Relative mRNA abundance of intestinal Fxr and its target gene mRNAs. n = 4 or 5 (5, 5, 5, 4) mice/group. Fxr: F3,15 = 23.16, Shp: F3,15 = 7.384, Fgf15: F3,15 = 7.121. b,c, GTT (b) and AUC (c). n = 4 or 5 (5, 5, 5, 4) mice/group. c, F3,15 = 20.58. d, ITT. n = 4 or 5 (5, 5, 5, 4) mice/group. e,f, Fasting glucose (e) and insulin (f) levels. n = 4 or 5 (5, 5, 5, 4) mice/group. e, F3,15 = 10.23; f, F3,15 = 5.074. g, HOMA-IR. n = 4 or 5 (5, 5, 5, 4) mice/group. F3,15 = 11.49. h, Energy expenditure. n = 4 or 5 (5, 5, 5, 4) mice/group. i, Relative mRNA abundance of the indicated thermogenic genes in sWAT; mice were placed at 4 °C for 24 h before killing. n = 4 or 5 (5, 5, 5, 4)/group. Ucp1: F3,15 = 4.722, Tmem26: F3,15 = 8.348, Pgc1a: F3,15 = 5.669. j, Western blot analysis (cropping of blot images) of UCP1 protein expression in sWAT and the statistical graph, mice were placed at 4 °C for 24 h before killing. n = 3 mice/group. F3,8 = 13. k, UCP1 immunohistologic staining of sWAT sections; mice were placed at 4 °C for 24 h before killing. n = 3 mice/group, three images per mouse. Scale bars, 50 μm. All P values were determined by one-way ANOVA with Tukey’s correction, *P < 0.05, **P < 0.01 versus Fxrfl/fl + vehicle. All data are presented as the mean ± s.e.m.

