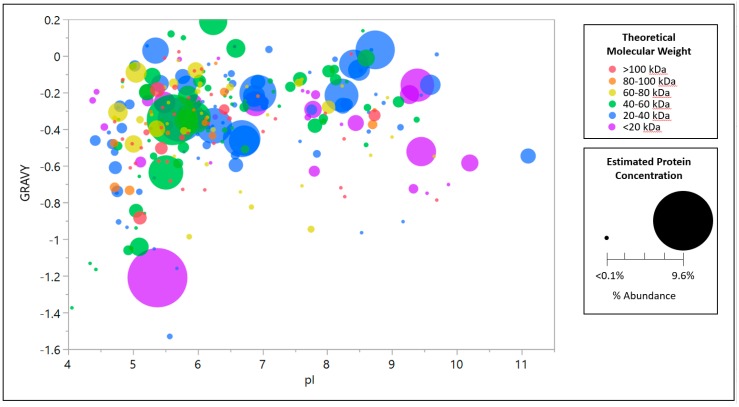
Figure A1.
Host cell protein bubble plot distribution by approximate molar percent abundance, theoretical molecular weight, theoretical isoelectric point, and grand average of hydropathy clarified for null CHO-S cell culture harvest material used in this work as the HCP population fluorescently tagged for solid phase peptide library screening for null CHO-S abundance.

