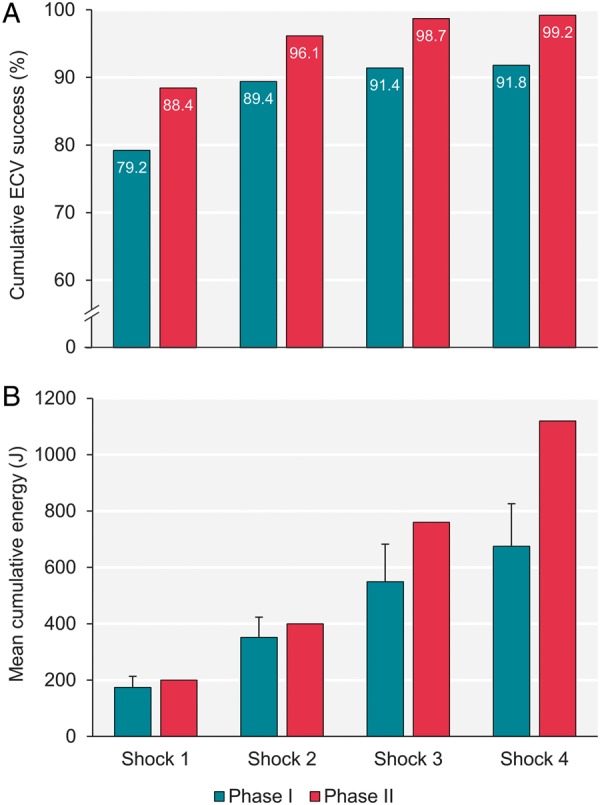
Figure 3.

Cumulative ECV success (A) and energy delivered (B) before (Phase I) and after (Phase II) implementing the Ottawa AF cardioversion protocol, per shock. Error bars depict standard deviation. P-value ≤0.02 for all shock comparisons between Phases I and II. ECV, electrical cardioversion.
