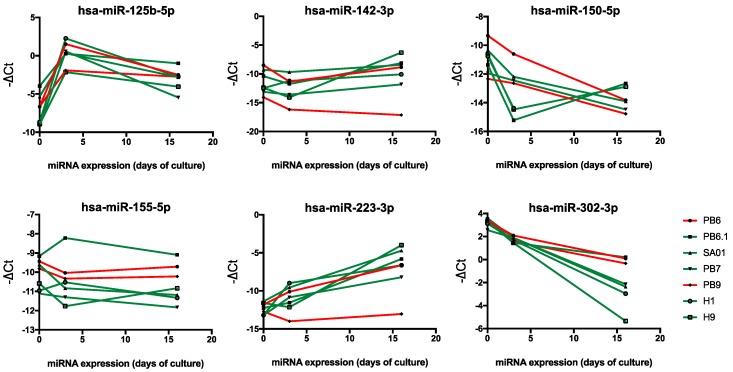
Figure 2.
Hematopoiesis-related miRNA expression during EB culture. Five hematopoietic-competent PSCs (PB 6.1, PB7, SA01, H1, H9) and two hematopoietic–deficient ones (PB6, PB9) were analyzed at 0, 3 and 16 days in the course of hematopoietic differentiation (day 0 representing the undifferentiated stage) by qRT-PCR. Graphs represent the expression kinetics of hsa-miR-125b-5p, hsa-miR-142-3p, hsa-miR-150-5p, hsa-miR-155-5p, hsa-miR-223-3p, and the hPSC-specific miR-302-3p, estimated by a –ΔCt calculation (with ΔCt = Ct miRNA – Ct RNU48). Hematopoietic-competent and hematopoietic-deficient PSCs are represented by green and red lines, respectively.

