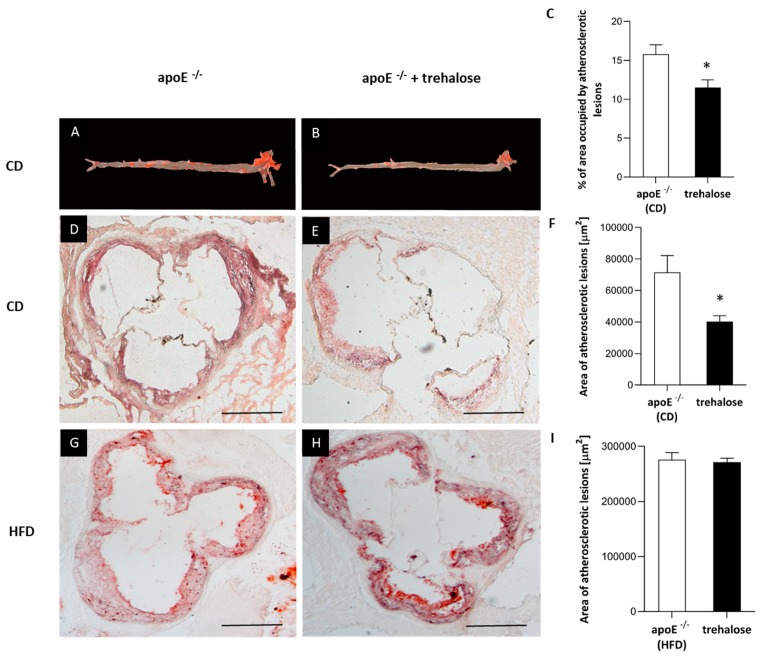
Figure 2.
Atherosclerotic lesions in trehalose-treated apoE−/− mice. Sudan IV-stained representative aortas in apoE−/− mice on a CD (A) and trehalose-treated apoE−/− mice on a CD (B). Representative micrographs showing oil-red O-stained atherosclerotic lesions measured by the atherosclerosis evaluation at the aortic sinus in the aorta of apoE−/− mice on a CD (D), trehalose-treated apoE−/− mice on a CD (E), apoE−/− mice on an HFD (G), and trehalose-treated apoE−/− mice on an HFD (H). Quantitative analysis of atherosclerotic lesions areas in apoE−/− mice and trehalose-treated apoE−/− mice on a CD or an HFD measured by the en face (C) or cross section methods (F,I) (mean ± SEM; * p < 0.05 as compared to apoE−/− mice on a CD; n = 7–11 per group). Scale bars = 500 µm.

