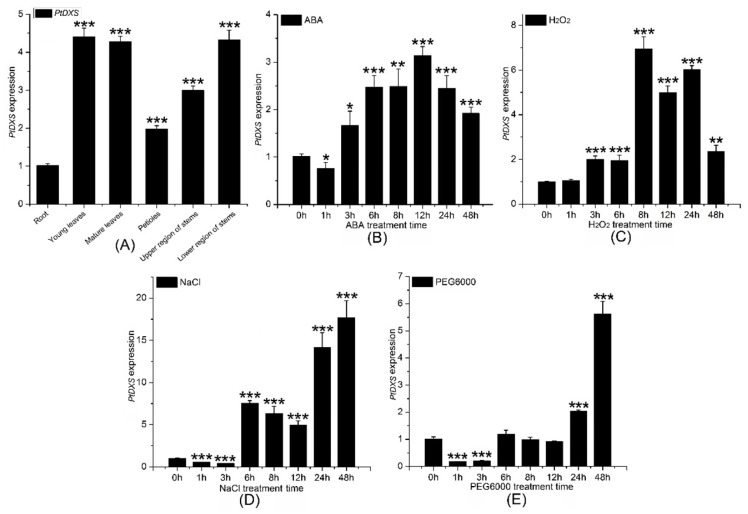
Figure 4.
Comparison of PtDXS expression in various tissues and in response to stresses. (A) Comparison of the PtDXS expression in the indicated tissues. Comparison of the PtDXS expression level in young leaves followed by different treatments and times (B) 200 μM ABA, (C) 2 mM H2O2, (D) 200 mM NaCl, and (E) 10% PEG6000. All experiments have been normalized by βactin as an internal reference; bars represent means ± standard deviation (SD; n = 3); three independent biological experiments were performed with three repeats; asterisks represent significant differences in comparing with 0 h treatment as the control (Student’s t-test; *, **, and ***, p < 0.05, p < 0.01, and p < 0.001, respectively).

